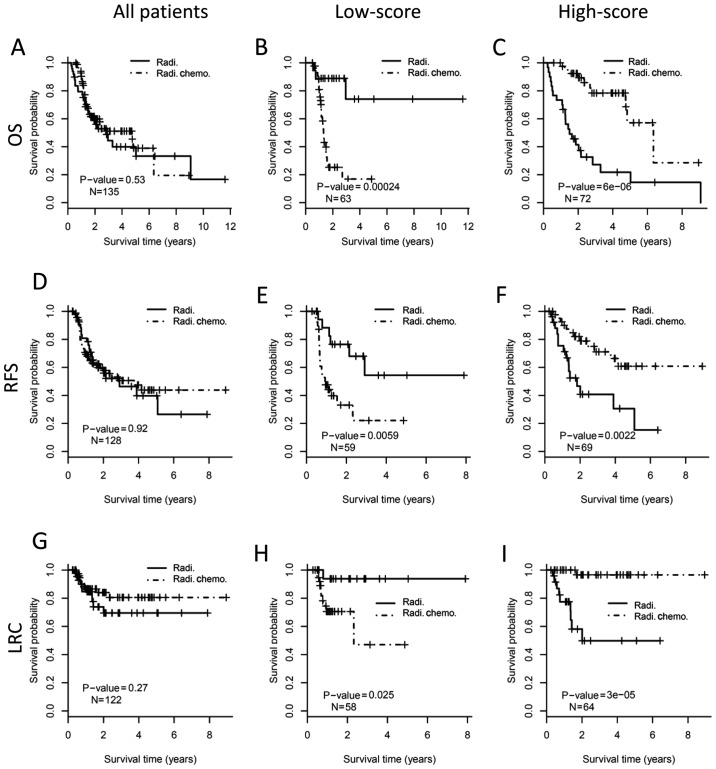
Figure 4.
Predictive value of 22-gene signature in patients at clinical high-risk. The entire cohort of high-risk patients (the left column), low-score subgroup (the middle column) and high-score subgroup (the right column) stratified by 22-gene signature are analyzed respectively. The upper, middle and the bottom panels show OS, RFS and LRC, respectively. Kaplan-Meier curves show the outcome of patients with different postoperative treatments. The P-value of each pair of Kaplan-Meier curves is calculated by log-rank test. (A) OS analysis for all patients at clinical high-risk. (B) OS analysis for patients with low-score by 22-gene signature. (C) OS analysis for patients with high-score by 22-gene signature. (D) RFS analysis for all patients at clinical high-risk. (E) RFS analysis for patients with low-score by 22-gene signature. (F) RFS analysis for patients with high-score by 22-gene signature. (G) LRC analysis for all patients at clinical high-risk. (H) LRC analysis for patients with low-score by 22-gene signature. (I) LRC analysis for patients with high-score by 22-gene signature. OS, overall survival; RFS, relapse free survival; LRC, local regional control; Radi., radiotherapy; Radi.Chemo., concurrent chemoradiotherapy.

