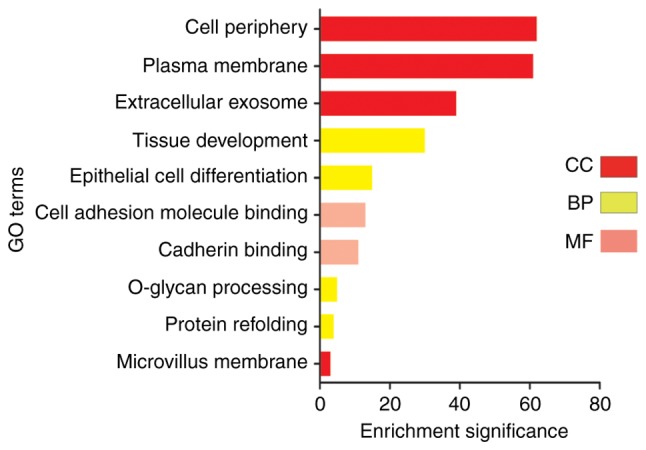
Figure 3.

GO terms: Upregulation. Red coloration represents the BP of DEGs, coral coloration represents the CC of DEGs and aqua coloration represents the MF of DEGs (fold-change >2). GO, Gene Ontology; DEGs, differentially expressed genes; BP, biological process; CC, cellular component; MF, molecular function.
