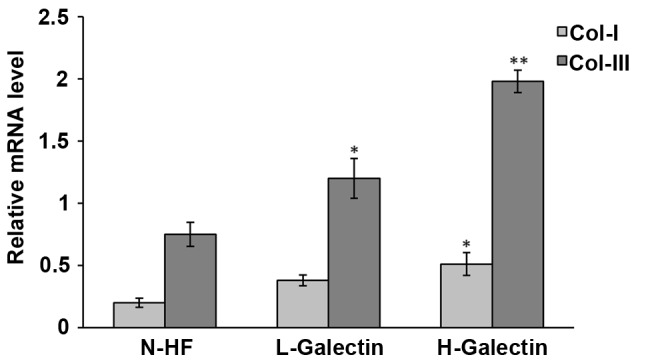
Figure 5.

Expression levels of type I and II procollagen mRNA in fibroblasts cultured with different concentrations of galectin-7. *P<0.05, **P<0.01 vs. N-HF. N-HF, normal human fibroblasts; L-galectin concentration, ≤1.0 µg/ml; H-galectin concentration, >1.0 µg/ml. Data was presented as the mean ± standard deviation.
