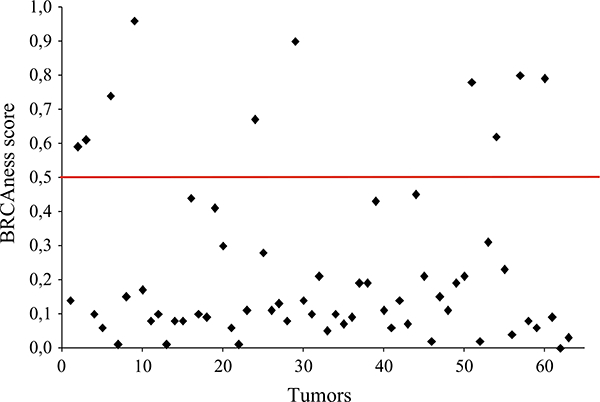
Fig. 1.

BRCAness analyses on breast tumors. In the Y axis, the obtained BRCAness scores are represented. Each dot represents a tumor. The red horizontal line indicates the 0.5 cut-off value established for BRCAness determination. Dots above the red line show BRCAness tumors, and dots below the red line represent non-BRCAness tumors. 10/63 tumors revealed BRCAness scores >0.6, a considerable distance from the scores of non-BRCAness tumors
