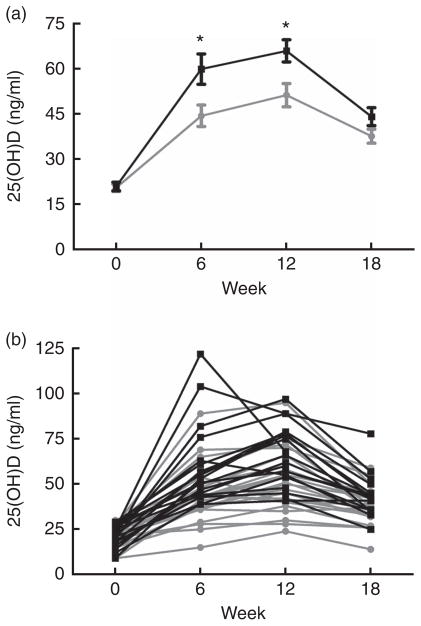
Fig. 3.
Serum concentrations of 25-hydroxyvitamin D (25(OH)D), grouped by treatment assignment, over the 18-week study course. (a) Mean 25(OH)D values per study group at each time point. (b) Individual 25(OH)D values for each patient at each time point. * Comparisons between treatment arms at specified time points (*P < 0·01).
 , Ergocalciferol;
 , cholecalciferol.

