
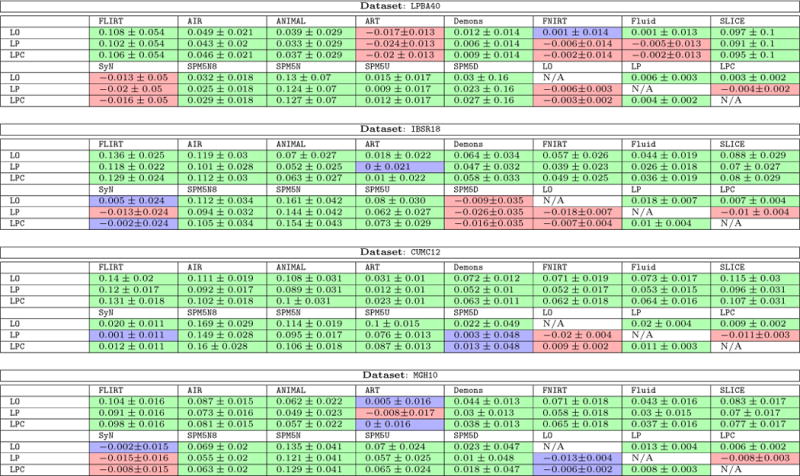
Table 3.
Mean and standard deviation of the difference of target overlap score between LDDMM variants (LDDMM optimization (LO), the proposed prediction network (LP) and prediction+correction network (LPC)) and all other methods for the image-to-image experiments.
|
The cell coloring indicates significant differences calculated from a pair-wise t-test: green indicates that the row-method is statistically significantly better than the column-method; red indicates that the row-method is statistically significantly worse than the column-method, and blue indicates the difference is not statistically significant (best-viewed in color). We use Bonferroni correction to safe-guard against spurious results due to multiple comparisons by dividing the significance level α by 204 (the total number of statistical tests). The significance level for rejection of the null-hypothesis is α = 0.05/204. Best-viewed in color.