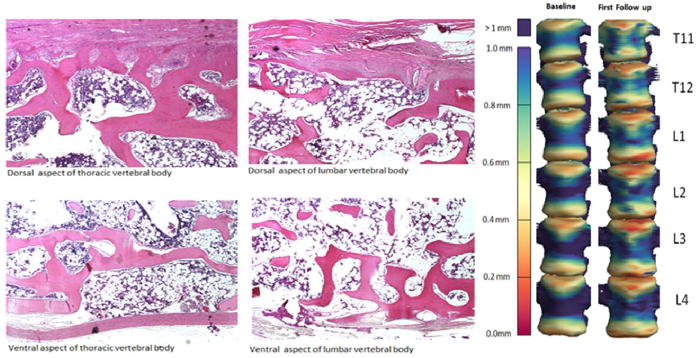
Figure 7.
(Left) Photomicrographs of sagittal sections at the dorsal and ventral aspects of lumbar and thoracic vertebral bodies stained with hematoxylin and eosin (H&E) illustrating lack or severe thinning of cortical bone. (Right) These locations of increased porosity match spatially with the cortical thickness map for thoracic (T) and lumbar (L) vertebrae at time of baseline computed tomography scan (2 months pre IR) versus time of first follow-up imaging (2 months post IR). The cortical thickness (in millimeters) is color coded in the scale to the left of the vertebrae.

