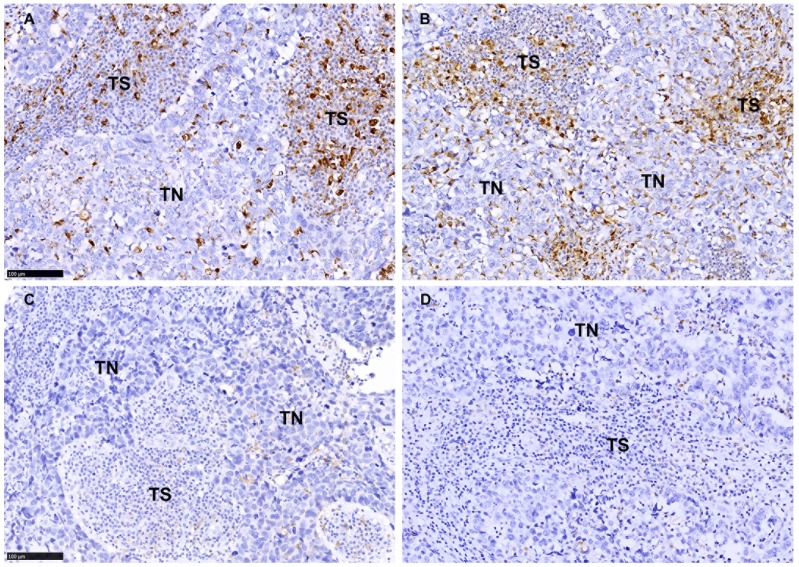
Fig 2.
The density and distribution pattern of macrophage infiltration characterized by CD68 and CD163 immunoreactivity in the tumor nest (TN) and tumor stroma (TS) of BLBC. A-B Representative images of high density of CD68+ staining (A) and CD163 staining (B) in TN and TS. C-D Representative images of low density of CD68+ staining (C) and CD163 staining (D) in TN and TS. Scale bar, 100 μm

