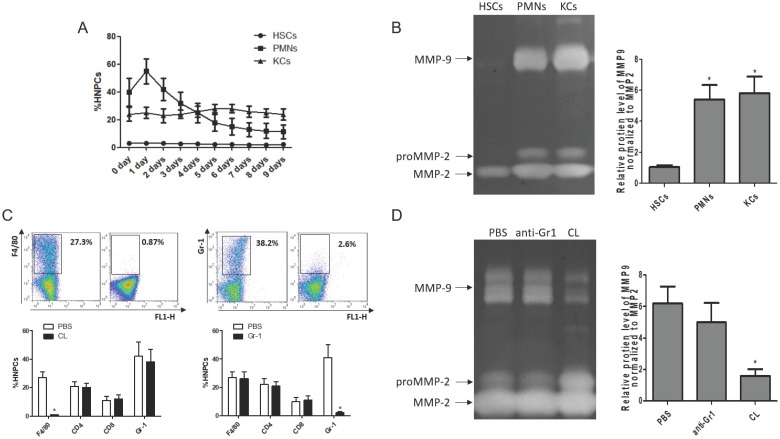
Figure 3.
Cellular source of MMP9 in the fibrotic liver. (A) The rates of HSCs, PMNs and KCs were determined by flow cytometry based on specific fluorescent antibodies (PE-anti-desmin and FITC-anti-GFAP, PE-anti-Cr1, PE-anti-F4/80). (B) MMPs levels were determined by zymography at the time point of TAA withdrawal. (C) Efficiency rates of KC or PMN depletion were determined by flow cytometry at 24 hours after administration. (D) MMPs levels were determined by zymography in liver tissues after KC or PMN depletion. Data were expressed as mean ± SD; n= 5, *P <0.05 (compared with control). HNPCs, hepatic non-parenchymal cells; HSCs, hepatic stellate cells; PMNs, polymorphonuclear neutrophils; KCs, Kupffer cells; CL, liposome-encapsulated clodronate.

