Figure 4.
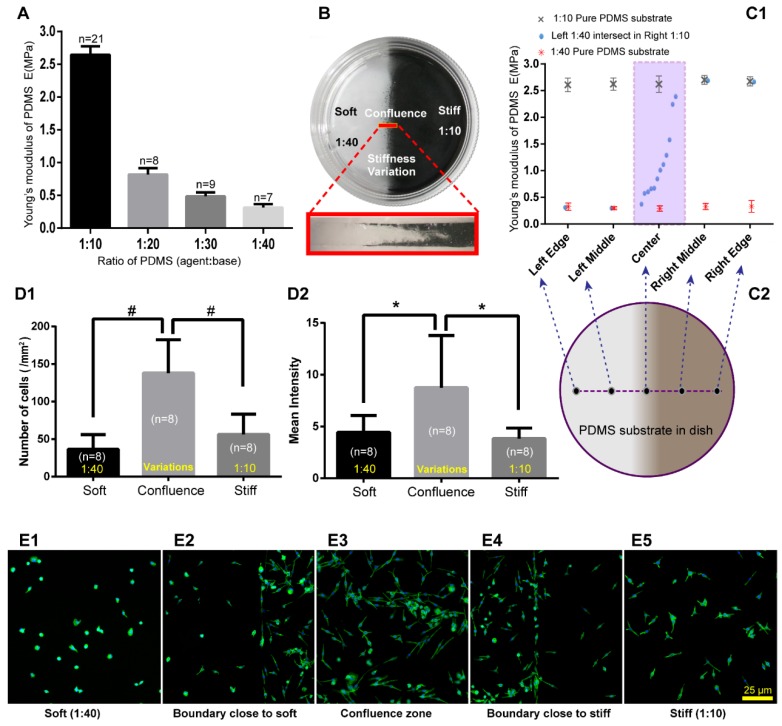
PDMS substrate stiffness properties and the distribution of RBL-2H3 cells on the PDMS substrate. (A) The Young's modulus of different ratios of PDMS was detected by Hysitron TI-950 nanomechanical instrument. The ratios of PDMS (agent:base) were 1:10, 1:20, 1:30, and 1:40. (B) Cell culture dish (diameter=35 mm) coated with PDMS substrate with stiffness variations using the FFC method. The sectional drawing of the area with stiffness variation of the soft PDMS (agent:base=1:40) and stiff PDMS (agent:base=1:10) which was marked with black carbon powder. (C1-C2) Young's modulus of substrate with stiffness variations was detected point-by-point along the diameter of the dish. Pure 1:10 and pure 1:40 PDMS substrates were also detected for comparison. (D1) The adherent cell number of every 1 mm2 on substrates that are soft (1:40), stiff (1:10) or with stiffness variations. (D2) The adherent cells correspond to fluorescence intensities on the substrates that are soft (1:40) or stiff (1:10) or that have a stiffness variation band. *p<0.05 versus boundary group, #p<0.01 versus boundary group. Values are given as the means±SE. (E1) Cells on the softer PDMS substrate (agent:base=1:40). (E2) Cells on the boundary of the softer side of the PDMS substrate with stiffness variation. (E3) Cells on the PDMS substrate with stiffness variation. (E4) Cells on the boundary of the stiffer side of the PDMS substrate with stiffness variation. (E5) Cells on the stiffer PDMS substrate (agent:base=1:10). All cells are RBL-2H3 mast cells, in which the cytoskeleton is dyed green by phalloidin, and the nuclei are dyed blue by DAPI. The scale bar is 25 µm.

