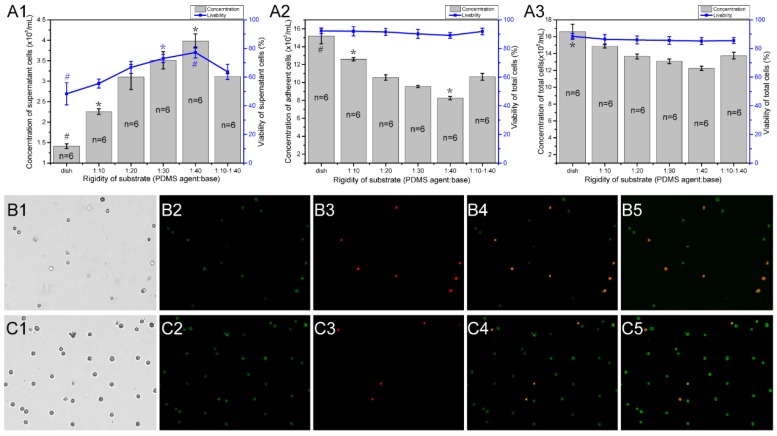
Figure 5.
The concentration and viability of RBL-2H3 cells on different rigidity regions of PDMS substrates. Cell culture dishes were used with different substrates as follows: normal cell culture dishes without coating PDMS (dish), dishes coated with a single stiffness PDMS substrate with a specified ratio of agent:base (1:10, 1:20, 1:30, and 1:40), and dishes coated with a stiffness gradient PDMS substrate with two intersecting sides: the stiffer side is 1:10, and the softer side is 1:40 (1:10-1:40). (A1) The concentration and viability of cells that did not adhere to the substrate. (A2) The concentration and viability of cells that adhered to the substrate. (A3) The concentration and viability of whole cells in the culture dish. The gray columns represent the number of cells. The blue line represents the survival rate of the cells. *p<0.05 versus 1:10-1:40 group, #p<0.01 versus 1:10-1:40 group. Values are given as the means ± SE. (B1-B5) and (C1-C5) The AO/PI method is used to determine the concentration and viability of cells that are not attached to and attached to the substrate, respectively.

