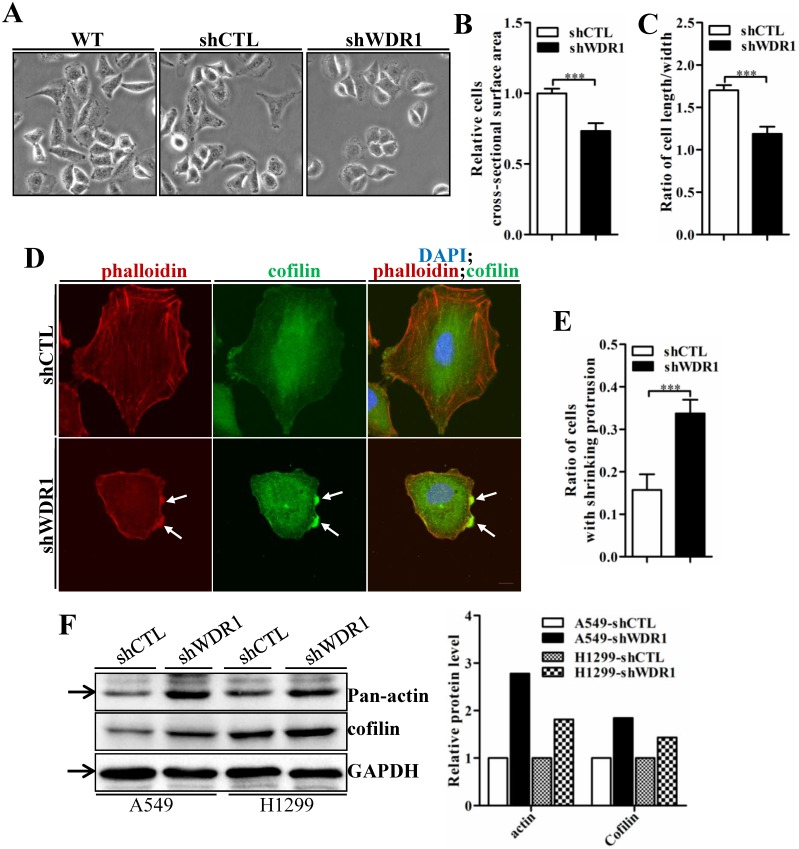
Figure 6.
WDR1 depletion results in cell morphological disruptions, F-actin accumulations, increased levels of actin and total-cofilin. A: Microscopic analysis of A549 cells. Compared with shCTL cells, cells became smaller and the cellular shape turned rounder in most of shWDR1 cells. B: A549 cell cross-sectional area calculated by ImageJ, which was significantly smaller in shWDR1 cells, compared with CTL. C: The ratio of cell length/width measured by ImageJ was significantly reduced in shWDR1 cells. D: Immunofluorescence staining for phalloidin and total-cofilin in A549 cells. In shWDR1 cells, F-actin accumulations were observed in the shrinking protrusions, and total-cofilin was rich where F-actin accumulations were present (arrows). E: The number of A549 cells with shrinking protrusion(s) was quantified. Compared with shCTL, the ratio of cells with shrinking protrusion(s) was dramatically increased in shWDR1 cells. F: In A549 and H1299 cells, western blotting analysis revealed increased levels of pan-actin and total-cofilin in shWDR1 cells. The target protein band is indicated by an arrow. Data are expressed as means ± SEM. ***P < 0.001. Scale bar = 10 μm.

