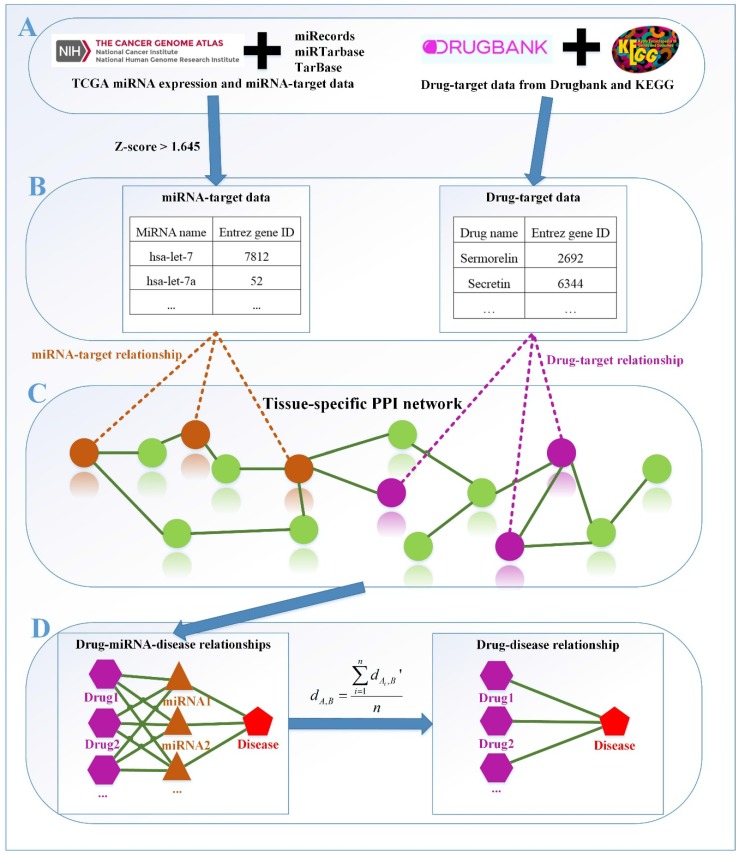
Figure 1.
The framework of our method miTS. (A) Data preparation: miRNA expression data of breast cancer got from TCGA, miRNA-target gene data got from miRecords, miRTarbase and TarBase, and drug-target gene data got from Drugbank and KEGG. (B) Data preprocessing: we use Z-score to obtain the differentially expressed miRNAs for diseases and preprocess the target information of drugs. (C) In the tissue-specific PPI network, the targets of drug and miRNA are mapped to the PPI network. Orange nodes represent the target genes of miRNAs. Purple nodes represent the target genes of drugs. Green nodes represent the background genes. (D) Based on the module distance algorithm, we construct a drug-miRNA-disease tripartite network, and then based on the tripartite network, we get potential drugs for diseases. dA,Brepresents the association score between a drug and a disease.

