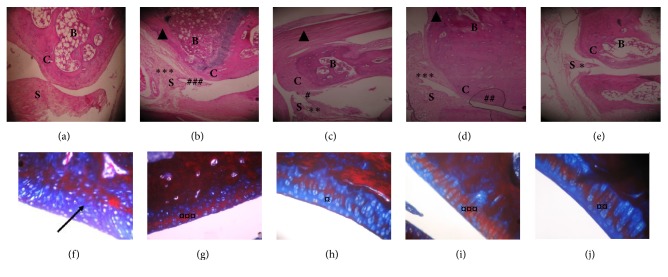
Figure 2.
Light micrographs of tibiotarsal joint sections of rat left hind paws. (a, b, c, d, e) H&E stained micrographs. (a) Normal rat shows normal appearance of the synovial membrane and cartilage. (b) AIA untreated rat shows severe synovial hyperplasia (∗∗∗) with cellular infiltration (###). (c) MTX-treated AIA rat shows moderate synovial hyperplasia (∗∗) and minimal infiltration (#). (d) Sesame oil-treated AIA rat shows severe synovial hyperplasia (∗∗∗) with some infiltration (##). (e) Δ9-THC/sesame oil-treated AIA rat shows minimal synovial hyperplasia (∗) with no infiltration. B: bone, C: cartilage, S: synovium. (f, g, h, i, j) Masson's Trichrome stained micrographs. (f) Normal rat shows normal and intact cartilage. (g) AIA untreated rat shows severe cartilage calcification (¤¤¤). (h) MTX-treated AIA rat shows minimal cartilage calcification (¤). (i) Sesame oil-treated AIA rat shows severe cartilage calcification (¤¤¤). (e) Δ9-THC/sesame oil-treated AIA rat shows moderate cartilage calcification (¤¤). (Original magnification x40.)

