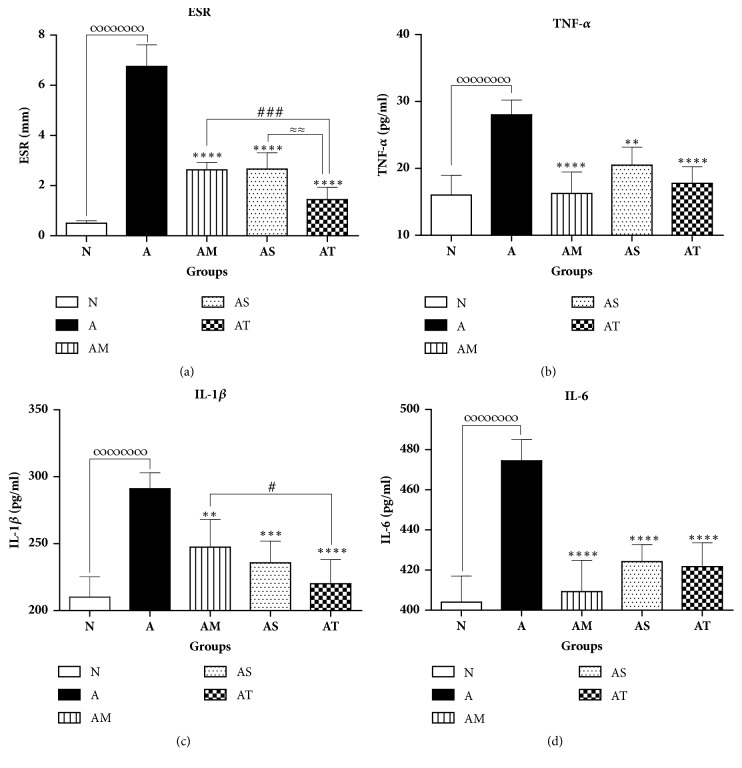
Figure 3.
Effect of treatments on inflammatory markers. (a) Blood ESR, serum, (b) TNF-α, (c) IL-1β, and (d) IL-6 among groups. All values are presented as mean ± SD of 8 rats per group. ∞∞∞∞p<0.0001 for A compared with N. ∗∗p<0.01, ∗∗∗p<0.001, ∗∗∗∗p<0.0001 compared with arthritic group A. #p<0.05, ###p<0.001 compared with positive control group AM. ≈≈p<0.01 between AS and AT.

