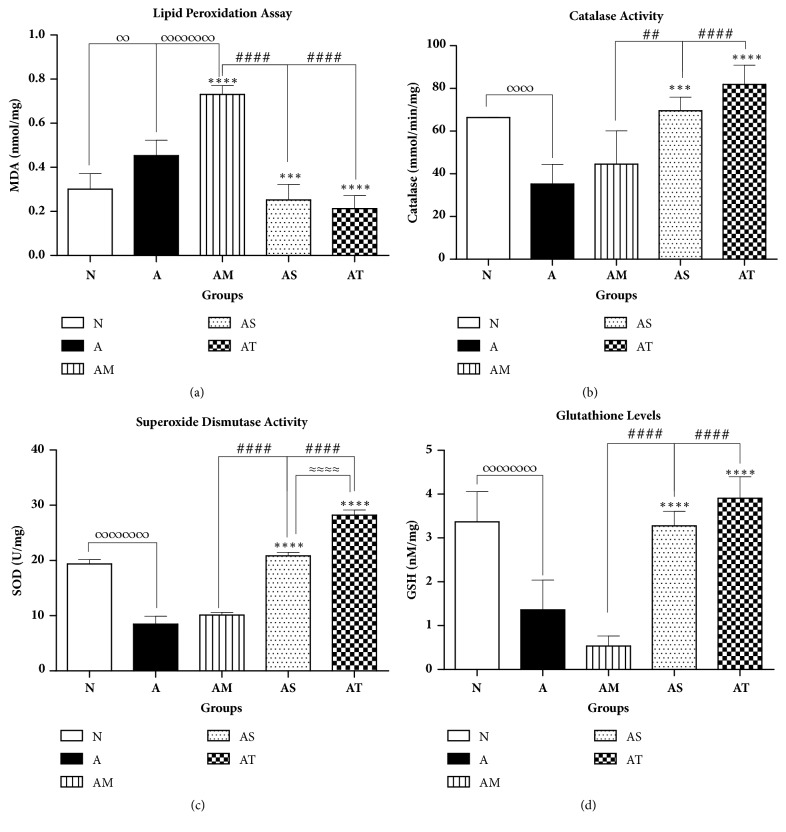
Figure 6.
Effect of treatments on liver oxidative stress and antioxidative defense biomarkers. (a) Lipid peroxidation levels (MDA); enzymatic activities of (b) catalase, (c) SOD, and (d) glutathione levels liver homogenates. All values are presented as mean ± SD of 8 rats per group. ∞p< 0.05, ∞∞p<0.01, and ∞∞∞∞p<0.0001 for A and/or AM compared with N. ∗∗∗p<0.001, ∗∗∗∗p<0.0001 compared with arthritic group A. ##p<0.01, ####p<0.0001 compared with positive control AM. ≈≈≈≈p<0.0001 between AS and AT.

