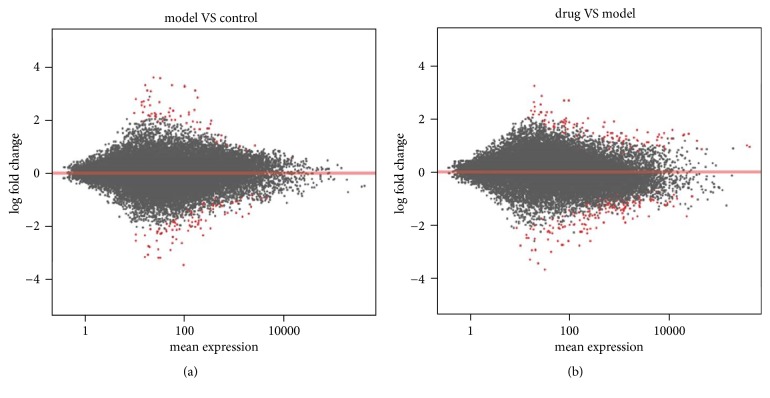
Figure 3.
MA-plot of the log2 fold changes over the mean of RNA-Seq read counts. The log2 fold change for a particular comparison is plotted on y-axis and the average of the counts normalized by size factor is shown on x-axis. Each gene is represented with a dot, and genes with FDR < 0.05 are shown in red. (a) Comparison of model group with control group. (b) Comparison of drug group with model group.

