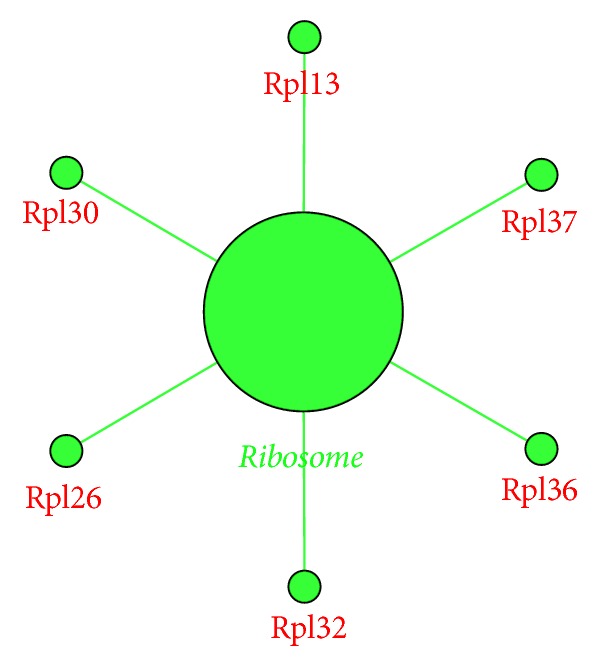
Figure 4.

KEGG pathway (FDR < 0.05) enriched by the 171 differentially expressed genes in model group compared to control group. Green colored dots are downregulated. The big dot is a sign of the enriched pathway and the big green word is the name of the pathway. Small green dots show the genes that are downregulated, and the red words are the names of downregulated genes.
