Figure 1.
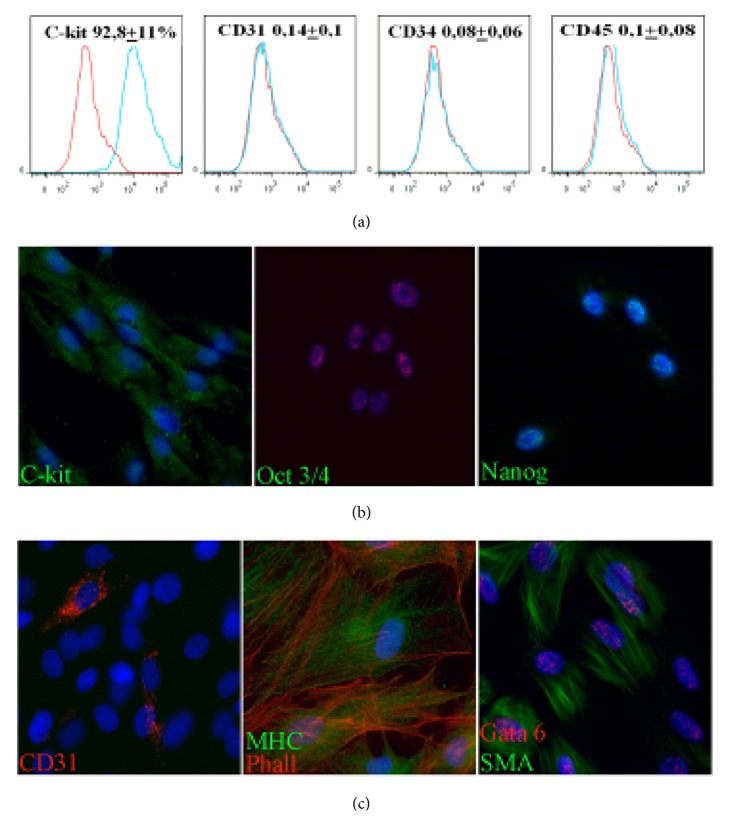
Isolation and characterization of rat cardiac progenitor cells (CPC). (a) Flow cytometry analysis of c-kit and hematopoietic markers (CD34, CD45 in CPC after isolation). Control IgG staining profiles are shown red border line histograms, while specific antibody staining profiles are shown blue in histograms. Data is expressed as mean+SD. (b) Expression of c-kit and pluripotency markers (Oct-3/4, Nanog) in CPC culture visualized by immunocytochemistry. (c) In vitro differentiation potential of isolated CPC toward cardiovascular images. Representative images of immunofluorescent staining in induced CPC for markers of endothelial (CD31 (PECAM)), cardiomyocytes (myosin heavy chains), and smooth muscle cells (Gata 6, smooth muscle actin).

