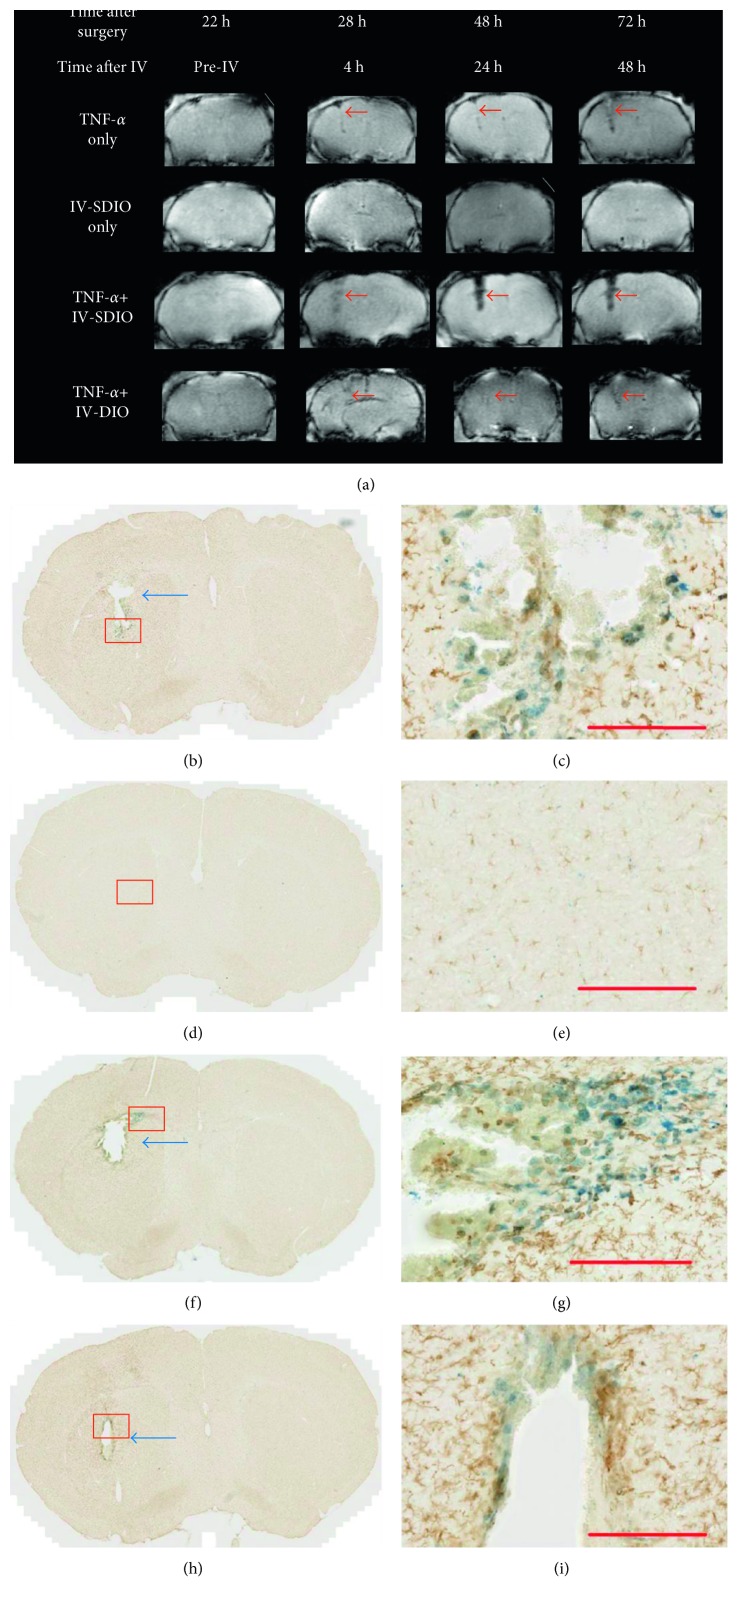
Figure 5.
Representative T2∗-weighted MRI and histological staining of mouse brains from different imaging groups. (a) T2∗-weighted MR images in each row represent MRI scans at different time points from the same animal in that group. The second row is an animal that did not receive intracerebral injection, only intravenous SDIO injection. The other three rows are animals that underwent TNF-α intracerebral injections. From left to right, column 1 represents images after TNF-α injection, but before IV injection of contrast agent, the rest of the columns of MRI represent time points after intravenous injection of stated contrast agent (except for row 1, these animals were not injected with contrast agents). Red arrows denote the needle tracks and regions highlighted by contrast agents. (b–i) Histological evaluation of the same animals as shown in (a): (b, c) TNF-α only; (d, e) IV-SDIO only; (f, g) TNF-α + IV-SDIO; (h, i) TNF-α + IV-DIO. Blue arrows in (b), (f), and (h) denote small cavities in the brain that were observed. Images (c), (e), (g), and (i) show magnification of Iba-1 and iron staining of selected areas (red square) from images (b), (d), (f), and (h). Activated microglia at inflammation sites were stained brown by Iba-1 antibody, while iron oxide nanoparticles accumulated in the vicinity region were stained blue by Perls' Prussian blue. Scale bars represent 200 µm.

