Figure 6.

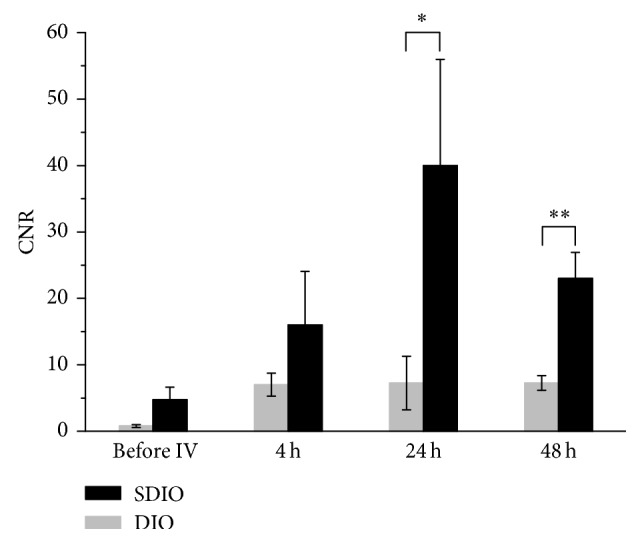
Average CNR of SDIO and DIO from MR images at different time points. All four animals from the experimental groups were calculated. ∗P < 0.05, ∗∗P < 0.01. All error bars present SEM (n=4).

Average CNR of SDIO and DIO from MR images at different time points. All four animals from the experimental groups were calculated. ∗P < 0.05, ∗∗P < 0.01. All error bars present SEM (n=4).