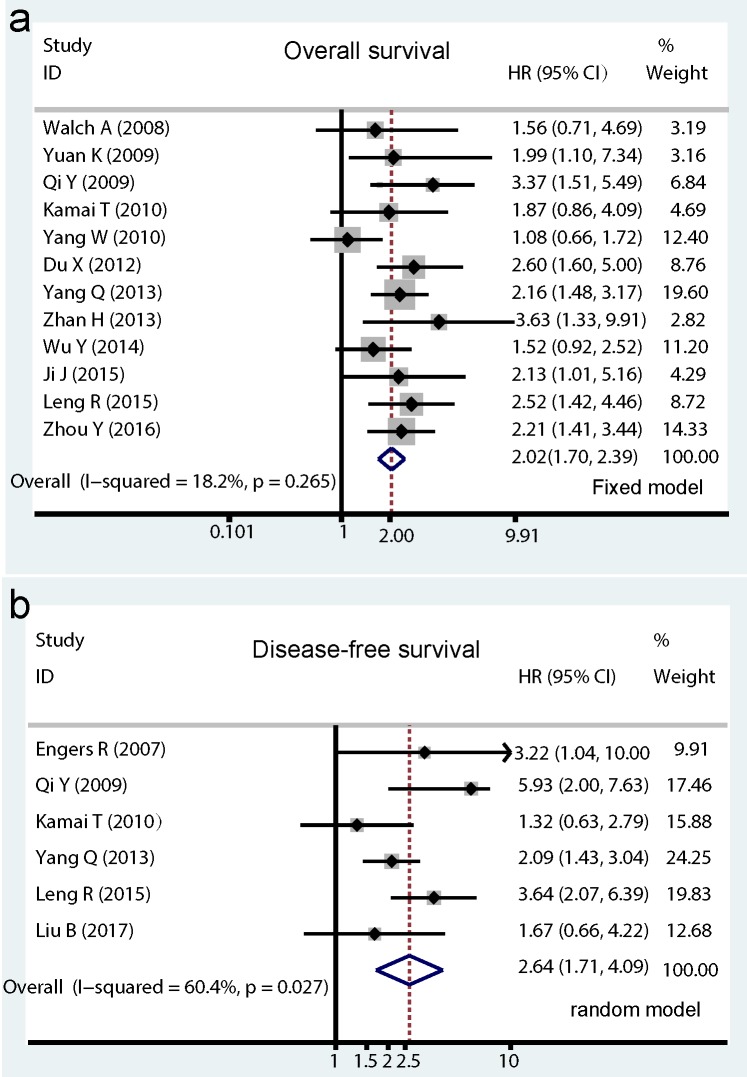
Fig 2.
Forrest plots of pooled hazard ratios estimate for Rac1 impact on overall survival (OS) and disease-free survival (DFS). Results are presented as individual hazard ratio (HR), and 95% confidence interval (CI). The middle point of the diamond represents the pooled HR and its left and right corners represent 95% CI. (a) shows pooled hazard ratio (HR) for overall survival (OS) analysis; (b) shows pooled HR for DFS analysis.

