
Fig. 2.
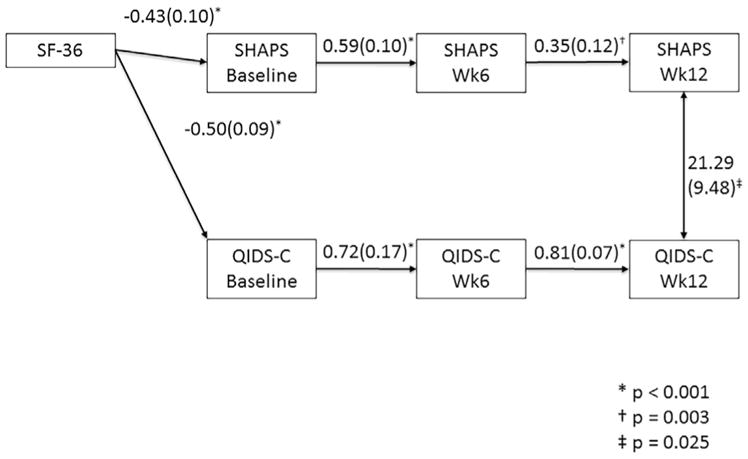
Pathway analysis results for SHAPS. Only significant pathways are shown, with the path coefficient and error. Of the covariates entered into the model, only SF-36 mental health sub-score showed significant association, being significantly related to baseline SHAPS and MEI scores. Not shown are, gender, race, history of recurrent depression and family history of depression..