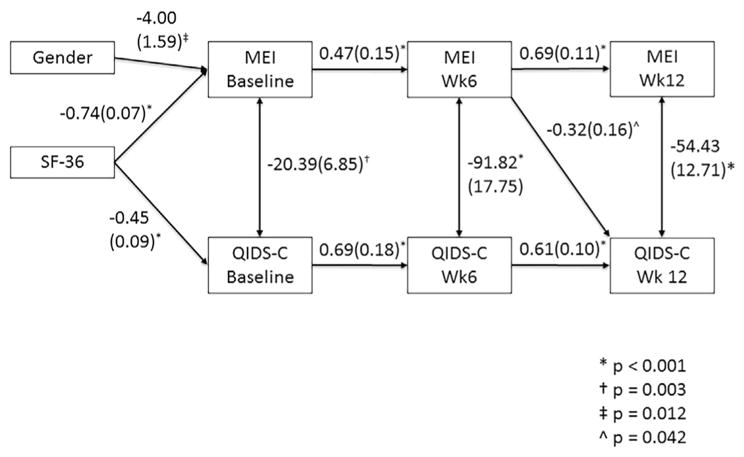
Fig. 3.

Pathway analysis results for the MEI total score. Only significant pathways are shown, with the path coefficient and error. Of the covariates entered into the model, SF-36 mental health sub-score and gender showed significant association. SF-36 was significantly related to baseline SHAPS and MEI scores. Gender was associated with baseline MEI score, with the direction indicating that men had higher baseline MEI scores. Not shown are race, history of recurrent depression and family history of depression.
