
Figure 3.
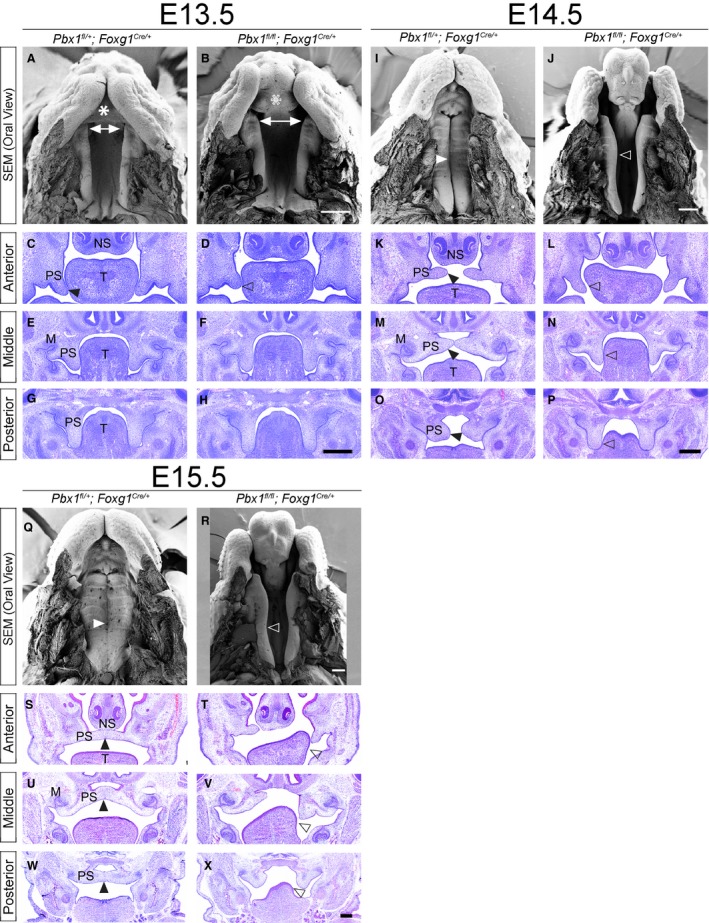
Epithelial loss of PBX1 results in clefting of the primary and secondary palate (CL/P). Scanning electron micrographs (SEM; top) and hematoxylin & eosin (H&E) stained coronal sections (bottom) of embryonic palate and oral cavity from E13.5–E15.5. Representative control: Pbx fl/+ ;Foxg1 Cre/+ (left) and mutant: Pbx1 fl/fl ;Foxg1 Cre/+ (right) embryos for each time point. E13.5: SEM shows dysmorphic primary palate in mutant (empty white asterisk in B) as compared with control (white asterisk in A). Anterior palatal shelves appear to be more widely spaced in mutant (white double‐headed arrows in A,B). H&E illustrates mild outgrowth defects of anterior secondary palatal shelves in mutant (empty black arrowhead in D) than in control (black arrowhead in C). Morphology of mutant middle and posterior secondary palatal shelves is otherwise comparable to that of control. E14.5: SEM highlights bilateral clefting of lip and primary palate in mutant (J) vs. control (I). Secondary palatal shelves remain unelevated and have not made contact medially (open white arrowhead in J), whereas in control they have elevated and made contact (white arrowhead in I). H&E sections show failure to elevate secondary palatal shelves in mutant as a potential consequence of aberrant trapping of shelves by tongue (empty black arrowhead in L,N,P), as compared with control (black arrowhead in K,M,O). E15.5: SEM shows complete clefting of secondary palate in mutant (open white arrowhead in R) vs. control (white arrowhead in Q). H&E illustrates that mutant secondary palatal shelves are cleft along entire A–P axis with aberrant contact with tongue (open black arrowhead in T,V,X), as compared with control (black arrowhead in S,U,W). M, molar tooth bud; NS, nasal septum; PS, palatal shelf; T, tongue. Scale bar: 400 μm.