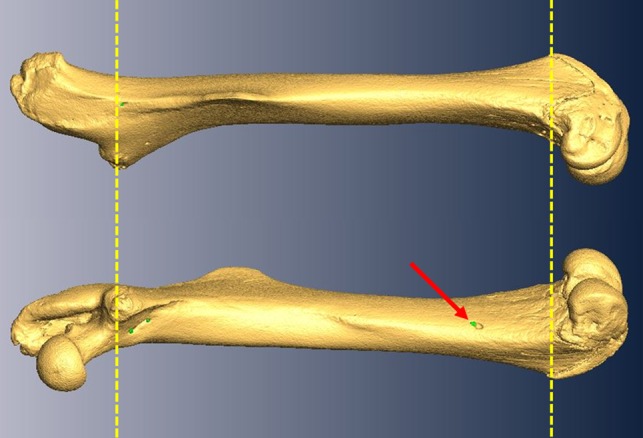
Figure 1.

Virtual rendering derived from μCT scans of a representative mouse femur from the HR line. The top image shows a lateral view of the femur and the bottom image shows a medial view. In each, to the left is proximal and to the right is distal. Red arrow denotes the presence of a nutrient foramen (green dots) in the distal third of the femur. All measurements were restricted to the region above the patellar groove and below the base of the femoral neck (as indicated by the yellow dashed lines) to prevent inclusion of metaphyseal and periosteal vessels which frequently penetrate bone outside this defined area.
