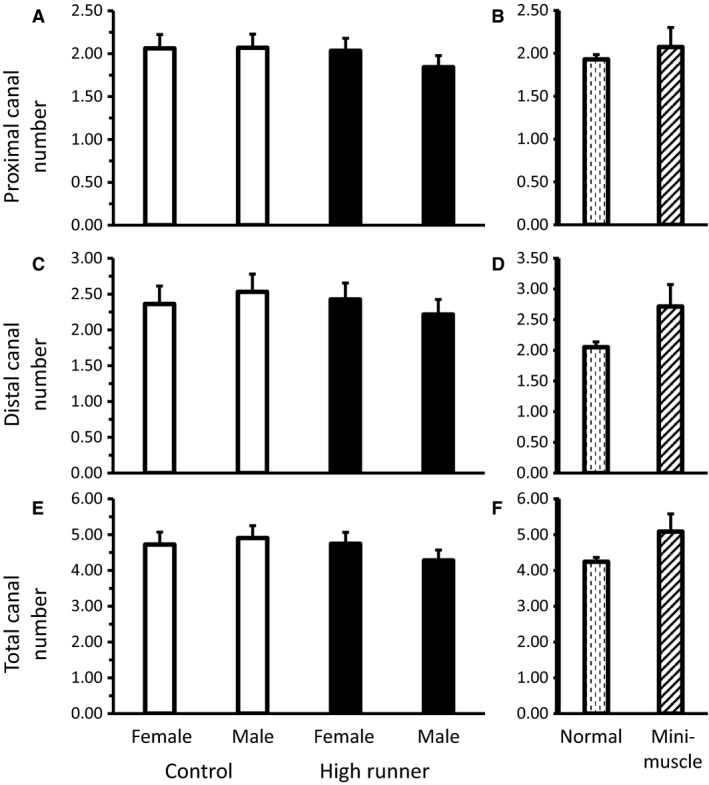
Figure 6.

Average count of nutrient canals (least squares means ± standard error) present in the (A) proximal (n = 137), (C) distal (n = 137), and (E) total (n = 137) diaphysis for male and female mice of HR (black bars) and C lines (white bars). Average number (least squares means ± standard error) of nutrient canals present in the (B) proximal, (D) distal, and (F) total diaphysis for mice without vs. with the mini‐muscle phenotype. No significant differences were found in comparisons.
