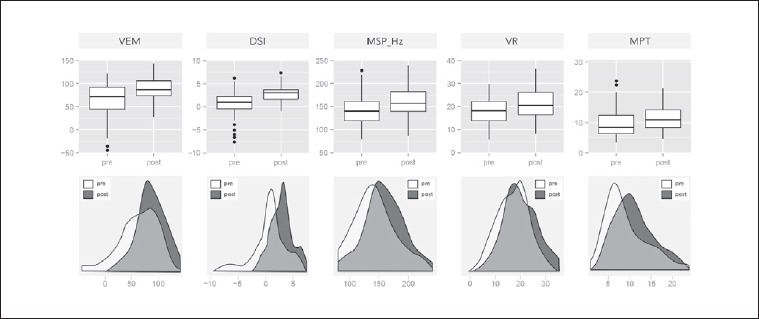
Fig. 3.

Selected objective acoustic and aerodynamic parameters before and after RE removal (VEM, DSI, MSP_Hz, VR [semitones], and MPT [sec]) for all RE patients. Upper row: pre-/post-operative comparison via boxplots, which display the median, quartiles, range of values covered by the data, and any outliers (single spots). Lower row: pre-/post-operative comparison via kernel density curves (Gaussian smoothing), in which histograms were shifted and overlaid with smooth density estimates to illustrate the different distributions.
