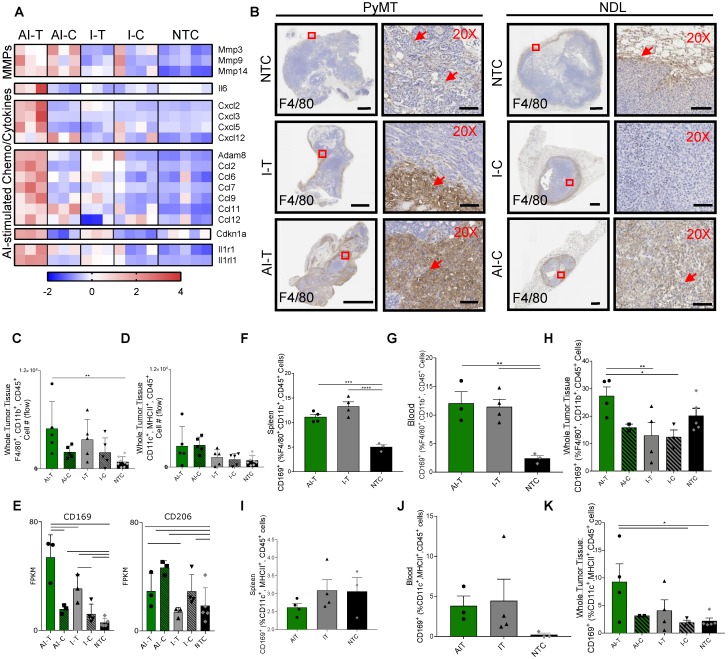
Figure 7.
Ablative-immunotherapy enhances intratumoral macrophages and shifts the macrophage phenotype. Treatment as in Figure 1A for NDL (beginning on day 21 after implantation) and PyMT (beginning when tumors reached 0.5 cm in the largest diameter) mice. Groups included: ablation-immunotherapy (AI), immunotherapy-alone (I), and no treatment control (NTC), where treated tumors are denoted as AI-T or I-T, and contralateral tumors are denoted as AI-C or I-C. (A) RNA-seq results at day 38 (samples as in Figure 1D) for matrix metalloproteinases (block 1), Il6 (block 2), TNF pathway cytokines (block 3), lymphocyte chemotaxis cytokines (4th and 5th blocks) and Il1r1 and Il1rl1 (6th block). Heatmaps are normalized by each gene using z-scores of the fragments per kilobase of transcript per million mapped reads (FPKM) values across all presented samples. (B) F4/80 IHC in treated and contralateral tumors in the PyMT and NDL models, respectively, as compared to NTC tumors (red arrows indicate F4/80 infiltration). Scale bars are 2 mm for whole tumors and 100 µm for 20X images. (C-D) Flow cytometry quantitation of the number of tumor-infiltrating (C) macrophages and (D) dendritic cells one week after ablation (day 38): AI (n=10 tumors), immunotherapy-alone (n=10 tumors), and NTC (n=8 tumors). **p<0.01 (ANOVA with Fisher's LSD test). (E) RNA-seq result for expression of the CD169 macrophage markers: Cd169 and Cd206 at day 38. For RNA-seq, bars represent significance of at least p < 0.01 as defined by CuffDiff. (F-H) Quantification of macrophages in the (F) spleen, (G) blood and (H) tumors expressing CD169 72 h after ablation (day 34, n=4 animals per group). (I-K) Quantification of dendritic cells in the (I) spleen, (J) blood and (K) tumors expressing CD169 72 h after ablation (day 34, n=4 animals per group) *p<0.05, **p<0.01, *** p <0.001, **** p <0.0001 (ANOVA with Fisher's LSD test). All data plotted are mean ± SEM.

