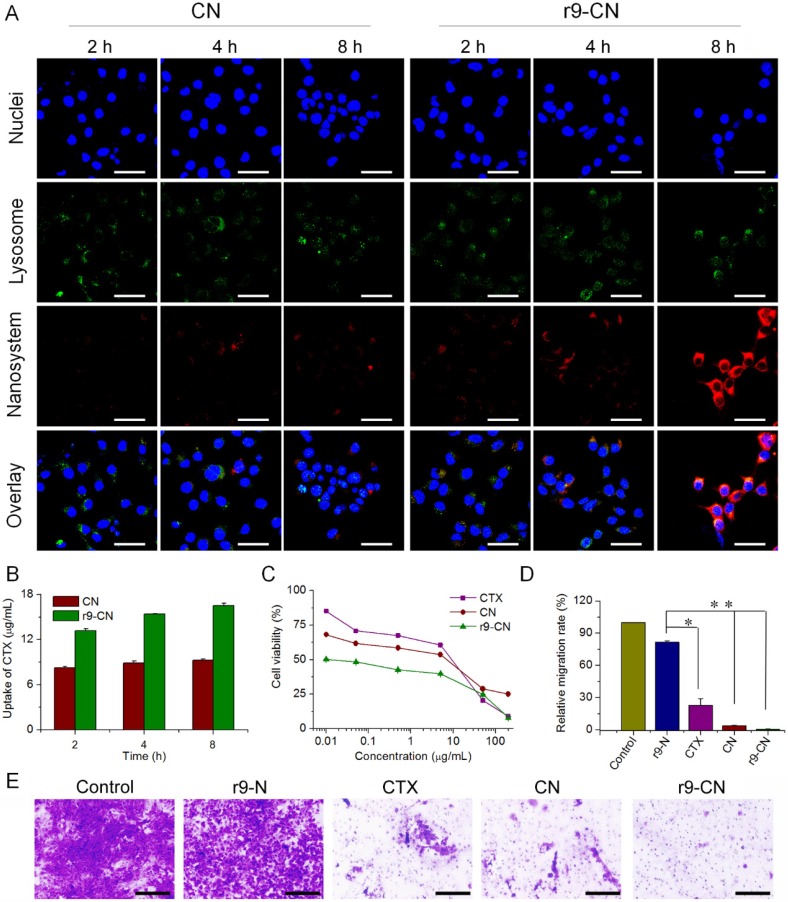
Figure 3.
Cellular uptake and in vitro therapeutic effects of r9-CN and CN in metastatic 4T1 cells. (A) Cellular uptake in 4T1 cells under LCSM; scale bar = 40 µm. (B) Quantified cellular internalization in 4T1 cells determined by flow cytometry; *p < 0.05. (C) Cytotoxicity of CTX, CN, and r9-CN in metastatic 4T1 cells. (D) Percentage of cells migrating across the transwell membrane compared to the negative control; *p < 0.05, **p < 0.01. (E) Typical images of cell migration across the transwell membrane, where cell clusters are illustrated as violet regions; scale bar = 200 µm.

