Figure 4.
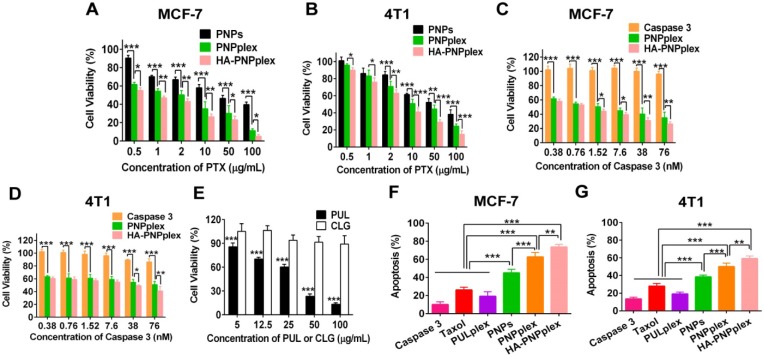
Cell viability and apoptosis. Cytotoxicity of preparations against (A) MCF-7 without expression of the endogenous caspase 3 and (B) 4T1 with normal caspase 3 expression cells after 48 h of incubation with PTX at concentrations ranging from 0.5 to 100 µg/mL (n = 5, *P < 0.05, **P < 0.01 and ***P < 0.001). Cytotoxicity of naked caspase 3 and other preparations against (C) MCF-7 and (D) 4T1 cells after 48 h incubation with caspase 3 at concentrations ranging from 0.38 to 76 nM (n = 5, *P < 0.05, **P < 0.01 and ***P < 0.001). (E) Comparison of cell viability between PUL and CLG with their concentrations from 5 to 100 µg/mL after 48 h of incubation in MCF-7 cells (n = 5, ***P < 0.001). Cell apoptosis percentage determined by FCM in (F) MCF-7 and (G) 4T1 cells induced by diverse formulations after 48 h of incubation at a fixed PTX concentration of 10 μg/mL or caspase 3 of 76 nM (n = 3, **P < 0.01 and ***P < 0.001).

