Figure 5.
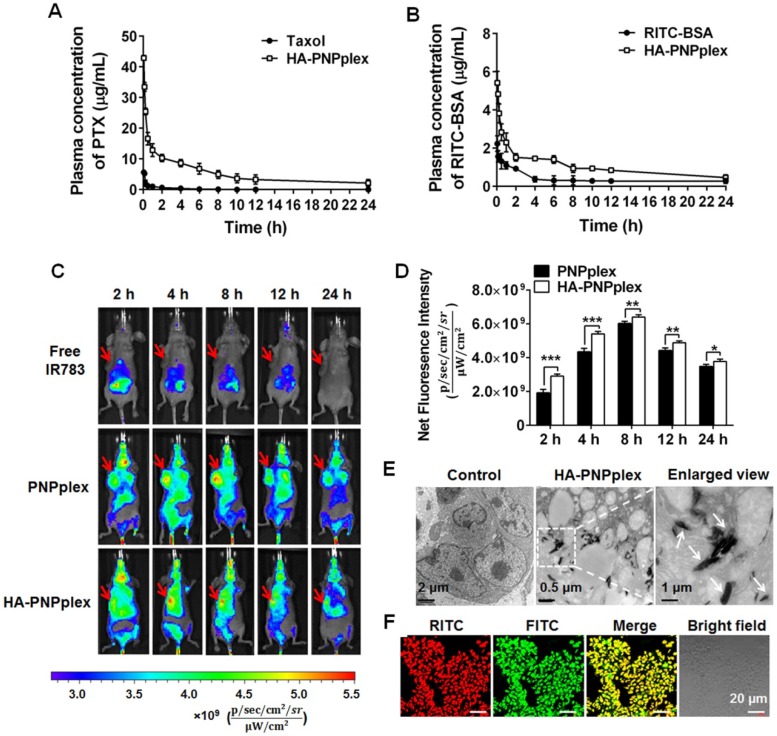
Pharmacokinetics, tumor targeting and penetration. Mean plasma concentration-time curves of (A) PTX and (B) RITC-BSA in different preparations (n = 4). (C) In vivo imaging of MCF-7 tumor-bearing nude Balb/C mice at different durations after injection of the IR 783-labeled nanoparticles at an IR783 dose of 2.5 mg/kg. Free IR783 was used as the control. (D) Quantification assay of tumor accumulation at different durations post injection (n = 3, *P < 0.05, **P < 0.05 and ***P < 0.001). In vivo penetration of HA-PNPplex into the tumor examined by (E) TEM and (F) CLSM after injection of dual-labeled HA-PNPplex at a FITC dose of 0.25 mg/kg and a RITC dose of 0.05 mg/kg. The tumors were collected at 2 h post injection.

