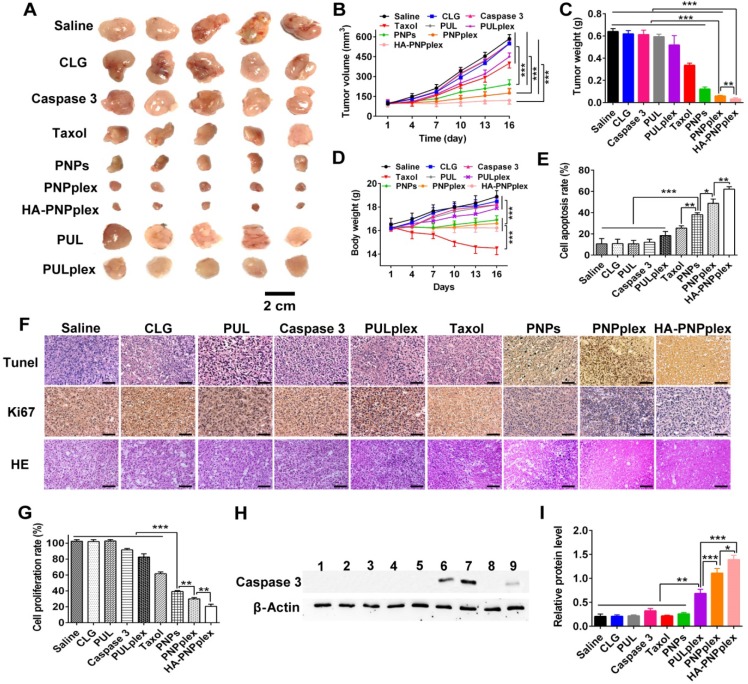
Figure 6.
Antitumor efficiency. (A) Image of representative tumors collected from mice at the end of the experiment. (B) Tumor growth curves (n = 6, ***P < 0.001). (C) Tumor weight variation (n = 6, ***P < 0.001 and **P < 0.01). (D) Body weight change curves (n = 6, ***P < 0.001). (E) Quantitative analysis of cell apoptosis (n = 3, *P < 0.05, **P < 0.01 and ***P < 0.001). (F) Ki67, TUNEL, and H&E staining analysis of the tumor collected on day 16. The brown-stained cells represent the positive cells in the TUNEL and Ki67 assay. Nuclei are stained blue, while extracellular matrix and cytoplasm are stained red in H&E analysis. The scale bar is 20 µm. (G) Quantitative analysis of cell proliferation (n = 3, **P < 0.01 and ***P < 0.001). (H) Intratumoral delivery of caspase 3 determined using WB assay. Formulations: 1, saline; 2, CLG; 3, naked caspase 3; 4, Taxol; 5, PNPs; 6, PNPplex; 7, HA-PNPplex; 8, PUL; 9, PULplex. The internal control for normalizing protein expression was β-actin. (I) Quantitative analysis of caspase 3 in tumor (n = 3, ***P < 0.001, **P < 0.01 and *P < 0.05).

