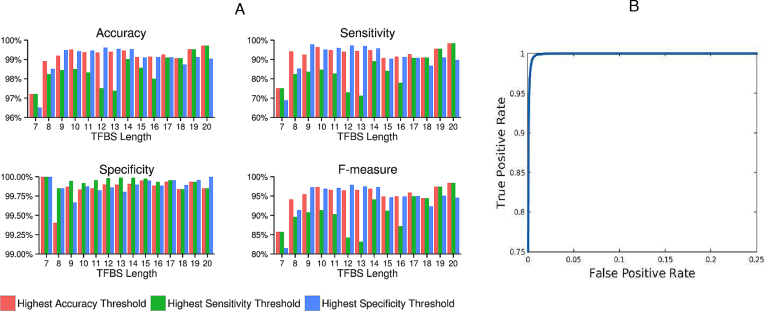
Figure 2.
The prediction performance of the DRAF models on the holdout test dataset. (A) The DRAF models were applied on the holdout test data using different threshold settings for the models’ prediction scores that provided the highest accuracy (pink bar), the highest sensitivity (green bar) and the highest specificity (blue bar), on the training dataset. (B) The ROC curve (true positive rate versus false positive rate) was performed for the predictions obtained from all the 14 DRAF models on the holdout test dataset. The AUC for the DRAF models is 0.9991.

