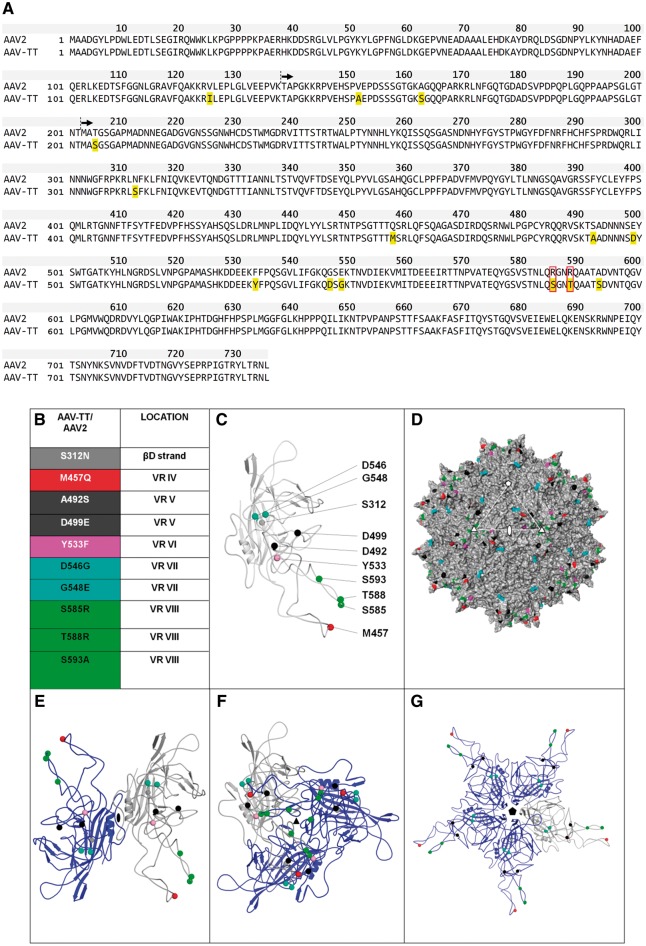
Figure 1.
AAV-TT capsid sequence and 3D model. (A) Protein alignment of AAV-TT and AAV2 (NCBI, accession number: NC_001401.2). VP1 is shown, with residues in yellow highlighting the amino acids that differ between the two capsids. Residues boxed in red correspond to the amino acid belonging to the basic patch that constitutes the HSPG binding site. Black arrows indicate the start sites of the VP2 and VP3 capsid proteins. (B) List of AAV-TT/AAV2 differing residues located in VP3 (the amino acid change at position 205 in AAV-TT is not listed as the 3D structure of the N-terminal end of VP3 is currently unknown). The positions of these residues within VP3 variable regions (VR) are indicated. (C) Ribbon diagram of VP3 monomer with AAV-TT/AAV2 differing residues shown as spheres and coloured according to list in B. (D) Surface representation of the 3D structure of AAV2 VP3 with the position of the residues which differ from AAV-TT coloured as in B. The icosahedral 2-, 3-, and 5-fold axes are indicated by an oval, triangle and pentagon, respectively. (E–G) Ribbon diagrams of VP3 dimer, trimer and pentamer with the reference monomer coloured grey and the symmetry related monomers coloured blue.

