Figure 2.
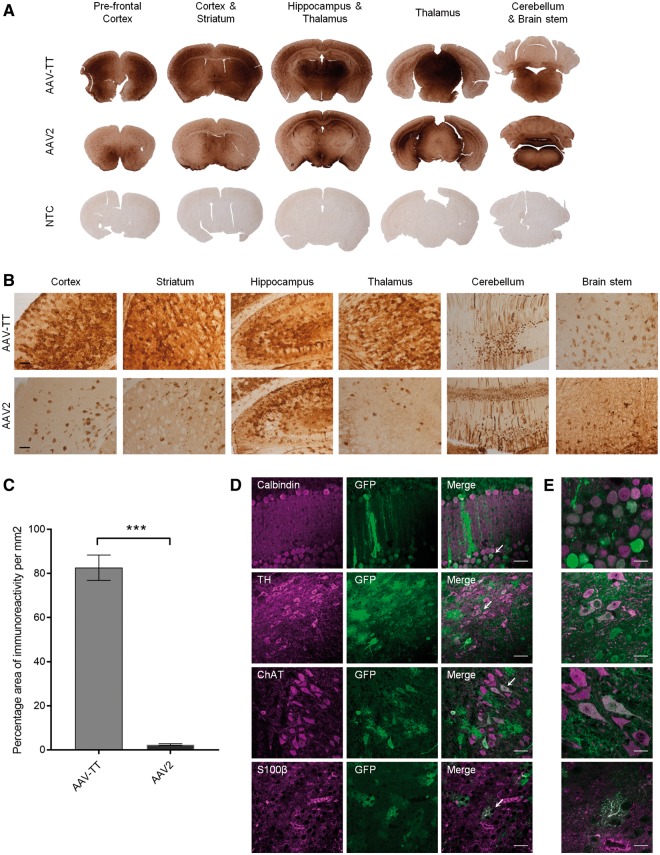
Intracerebroventricular injections in neonatal mice show superior transduction ability of AAV-TT across the CNS. 5 × 10¹⁰ vg of GFP-expressing AAV-TT or AAV2 vectors were injected unilaterally into the lateral ventricle of neonatal mice at postnatal Day 1 (P1) (n = 3 per condition). (A) Representative images of GFP signal observed 4 weeks post-injection in the different brain areas indicated. Brain sections derived from an untreated animal were used as negative control (NTC, non-transduced control, n = 3). (B) High magnification images of the sections shown in A. Scale bar = 100 µm. (C) GFP signal quantified as the percentage area of immunoreactivity measured in the striatum of the injected hemisphere. Signal was significantly higher in AAV-TT as compared to AAV2 treated animals. Unpaired Student’s t-test, two-tailed, n = 3 per group. The data are presented as mean ± SEM; ***P < 0.001. (D) Representative images of native GFP fluorescence and calbindin, tyrosine hydroxylase (TH), choline acetyltransferase (ChAT) or S100β taken at 40× magnification show that AAV-TT has the ability to transduce Purkinje cells, dopaminergic neurons, cholinergic neurons and astrocytes, respectively. Scale bars = 50 µm. White arrows indicate the areas magnified in E. (E) Representative images taken at 100× magnification showing GFP expression in the areas indicated by white arrows in the corresponding panels in D. Scale bars = 20 µm.

