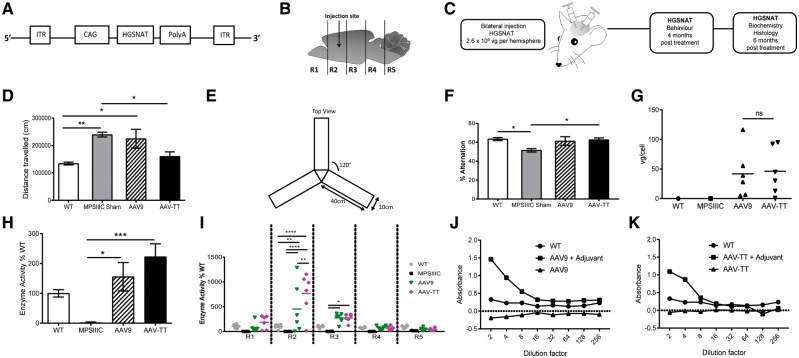
Figure 6.
AAV-TT effectively corrects disease phenotype in MPSIIIC mice. (A) AAV-HGSNAT vectors, packaged into AAV9 or AAV-TT capsids, were used to treat MPSIIIC mice. (B) Schematic of injection site and brain sectioning used for enzyme level determination. (C) Overview of treatment and analysis scheme. (D) Hyperactivity as measured by distance travelled by wild-type (wt, n = 8) and MPSIIIC sham (n = 11), AAV9 (n = 8) and AAV-TT (n = 7) treated MPSIIIC mice. (E) Configuration of Y-maze. (F) Cognitive ability as measured by the percentage of alternation in the Y- maze of wild-type (n = 10) and MPSIIIC sham (n = 12), AAV9 (n = 9) and AAV-TT (n = 9) treated MPSIIIC mice. (G) Vector genome copy numbers (vg/cell) measured by qPCR in whole brain tissue preparations from wild-type (n = 1), MPSIIIC (n = 1), AAV9 (n = 6) and AAV-TT (n = 6) treated MPSIIIC mice. (H) HGSNAT enzyme activity measured in whole brain preparations of wild-type (n = 6), MPSIIIC (n = 6), AAV9 (n = 6) and AAV-TT (n = 6) treated MPSIIIC mice. (I) HGSNAT enzyme activity measured in brain sections R1–R5. (J) Total IgG antibody responses against AAV9 capsid proteins as measured by ELISA. Absence of capsid-specific antibodies in brain homogenates of AAV9-coHGSNAT (n = 6) treated mice. (K) Total IgG antibody responses against AAV-TT capsid proteins as measured by ELISA. Absence of capsid-specific antibodies in brain homogenates of AAV-TT-HGSNAT (n = 6) treated mice. Positive controls consist of mice treated with vectors and adjuvant. ANOVA followed by Tukey’s post hoc multiple comparison test. Data are presented as mean ± SEM; *P < 0.05; **P < 0.01; ***P < 0.001; ****P < 0.0001.

