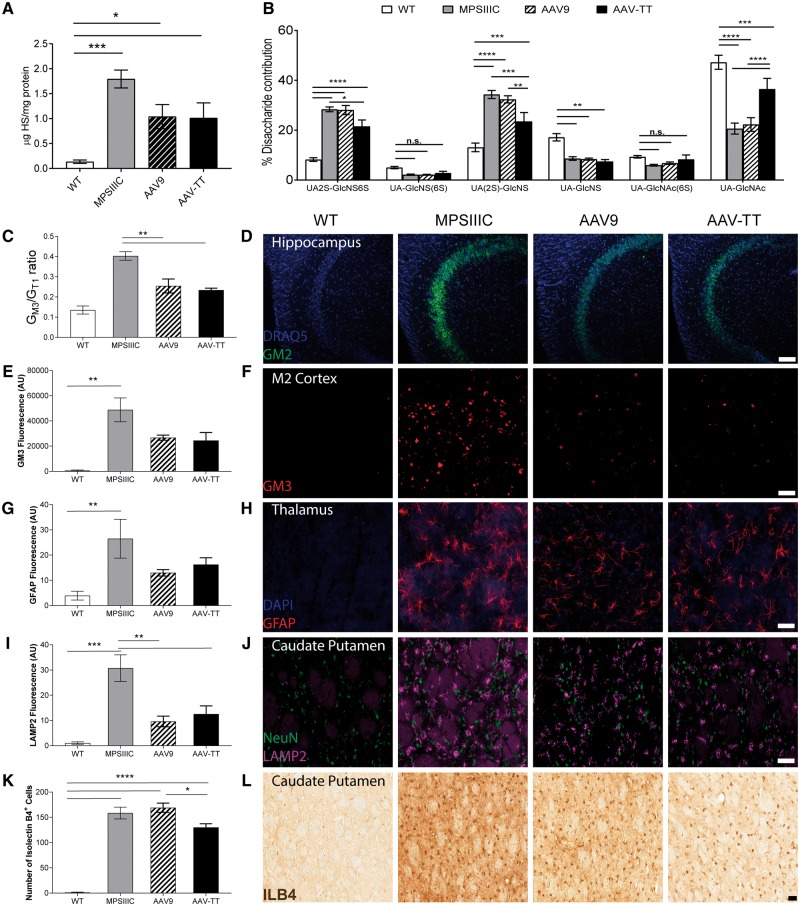
Figure 7.
AAV-TT reduces primary and secondary storage molecules leading to a reduction in neuroinflammation in MPSIIIC mice. (A) Primary storage i.e. total HS measured by reversed phase chromatography in brains in wild-type (wt, n = 6), untreated MPSIIIC (n = 6), AAV9 (n = 6) and AAV-TT (n = 6) treated MPSIIIC mice. (B) Measurement of the different disaccharide contributions in HS in wild-type (n = 6), untreated MPSIIIC (n = 6), AAV9 (n = 6) and AAV-TT (n = 6) treated MPSIIIC mice shows normalization of the relative proportion of HS that is NAc, 6S and 2S sulphated. (C) Secondary storage i.e. GM3 gangliosides measured by thin layer chromatography in homogenized brain tissues of wild-type (n = 4), untreated MPSIIIC (n = 3), AAV9 (n = 4) and AAV-TT (n = 4) treated MPSIIIC mice, which is reduced in treated MPSIIIC mice. (D) Storage of GM2 ganglioside in the hippocampus of wild-type (n = 2), untreated MPSIIIC (n = 6), AAV9 (n = 3) and AAV-TT (n = 4) treated MPSIIIC mice, which is reduced in treated MPSIIIC mice. (E and F) Storage of GM3 stained brain sections in the M2 cortex of wild-type (n = 2), untreated MPSIIIC (n = 6), AAV9 (n = 3) and AAV-TT (n = 4), which is reduced in treated MPSIIIC mice. Scale bar = 20 μm. (G and H) Confocal microscopy of GFAP stained brain sections in wild-type (n = 4), untreated MPSIIIC (n = 3), AAV9 (n = 4) and AAV-TT (n = 4) treated MPSIIIC mice shows trend towards reduction in the accumulation of GFAP positive astrocytes in the thalamus of treated MPSIIIC mice. (I and J) Confocal microscopy of LAMP2 stained brain sections in wild-type (n = 4), untreated MPSIIIC (n = 3), AAV9 (n = 4) and AAV-TT (n = 4) treated MPSIIIC mice shows reduction in lysosomal LAMP2 staining in the caudate putamen in treated MPSIIIC mice. (K and L) Confocal microscopy of ILB4 stained brain sections in wild-type (n = 4), untreated MPSIIIC (n = 4), AAV9 (n = 4) and AAV-TT (n = 4) treated MPSIIIC mice shows improvement in neuroinflammation in the caudate putamen in AAV-TT-HGSNAT treated mice. ANOVA followed by Tukey's post hoc multiple comparison test. Data are mean ± SEM; *P < 0.05; **P < 0.01; ***P < 0.001; ****P < 0.0001. Scale bar = 50 µm.

