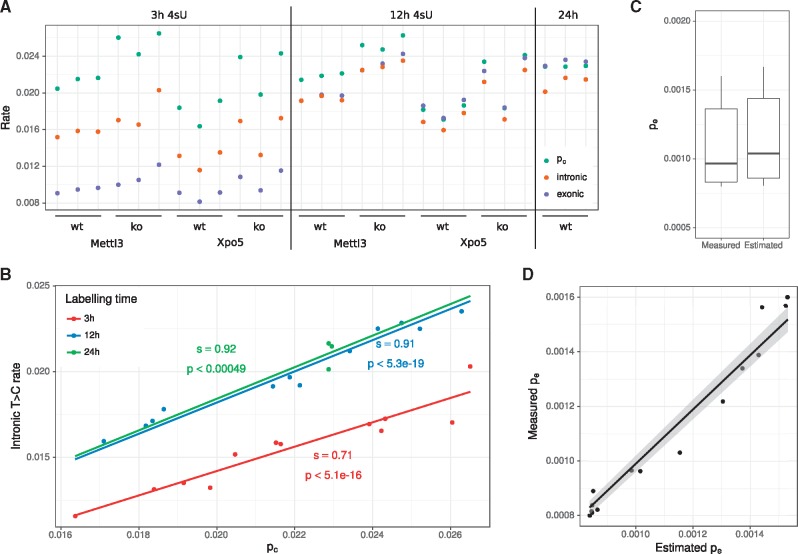
Fig. 4.
Evaluation of mESC data. (A) For all SLAM-seq experiments from Herzog et al. (2017), the estimated conversion rate pc is compared to the intronic and exonic T to C mismatch rates. (B) Linear regression analysis of pc against the intronic T to C mismatch rate. Slopes (s) and p values are indicated. For all three regressions . (C) The distribution of the error rate pe as measured in the 15 no4sU samples is compared to the estimated error rates in the 27 4sU samples [see (A)]. (D) pe can be predicted by linear regression of the other error rates. In the no4sU samples, pe can be directly measured by counting T to C mismatches. This shows the results of a leave-one-out cross validation in the no4sU samples comparing the predictions (x-axis) against the measured values (y-axis)

