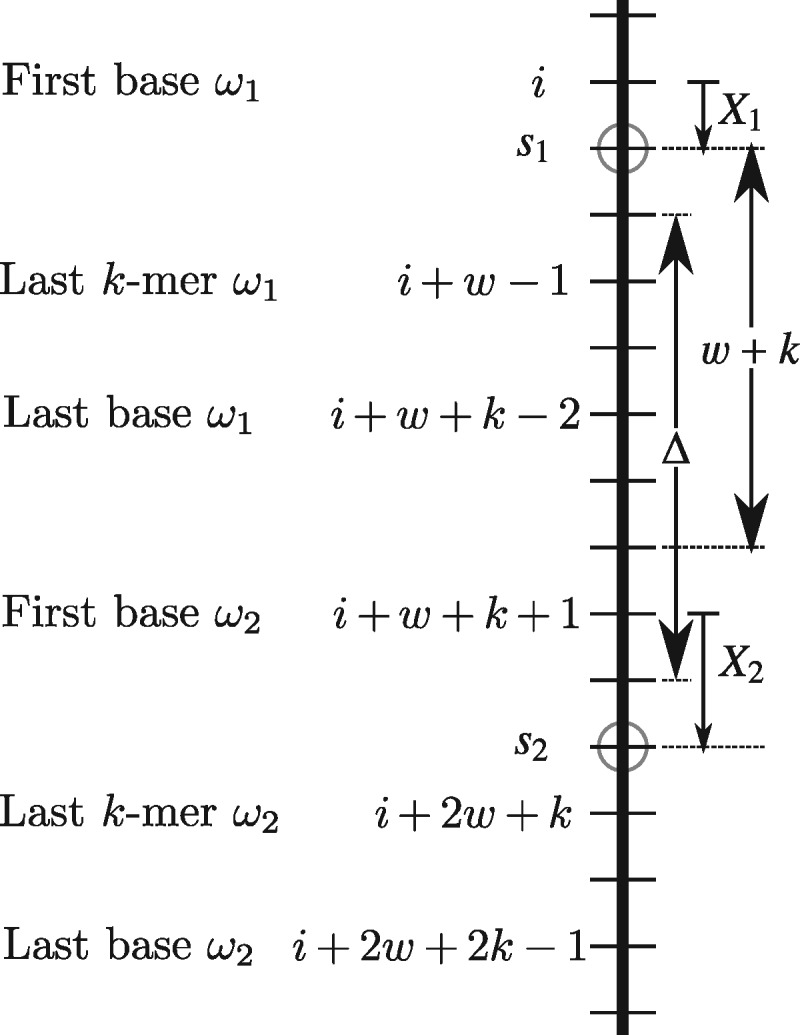
Fig. 2.

The sequence is represented by a thick vertical line, and each base is a tick mark. In this example, k = 3, w = 4, and . The first base, last k-mer start and last base of ω1 and ω2 are i, and , respectively. The selected k-mers are marked with a circle at positions s1 and s2. Δ is the number of bases between, and excluding, the selected k-mers. There are w + k windows that can be charged after ω1 and before ω2, between bases i + 1 and i + w + k included
