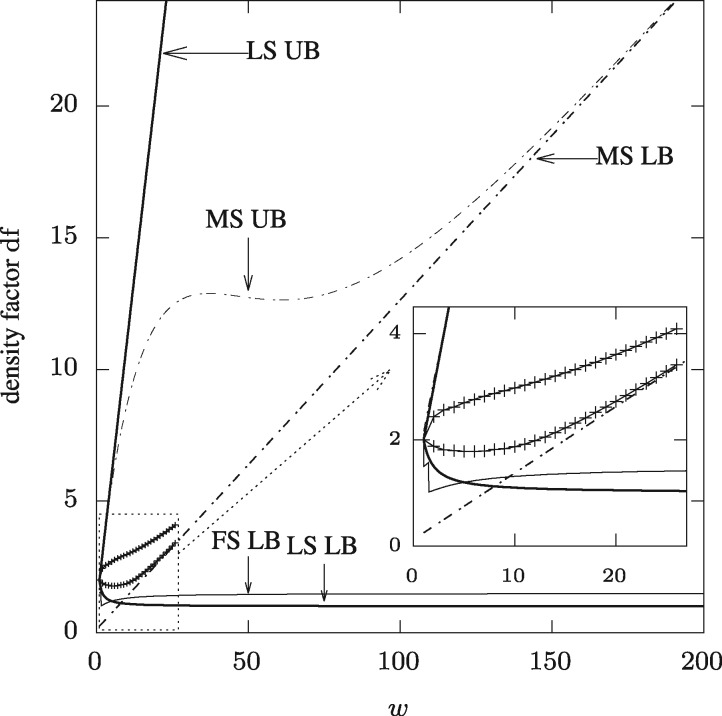
Fig. 3.
For a binary alphabet σ = 2 and a fix value of k = 3, this plots show the upper-bound and lower-bound for the local-schemes (thick lines ‘LS UB’ and ‘LS LB’) and for the minimizer-schemes (dashed lines ‘MS UB’ and ‘MS LB’). The thin line ‘FS LB’ is the lower-bound for forward scheme. In addition, in the inset, the gray lines show the actual best and worse density factor achievable by a minimizer schemes for k = 3 and for

