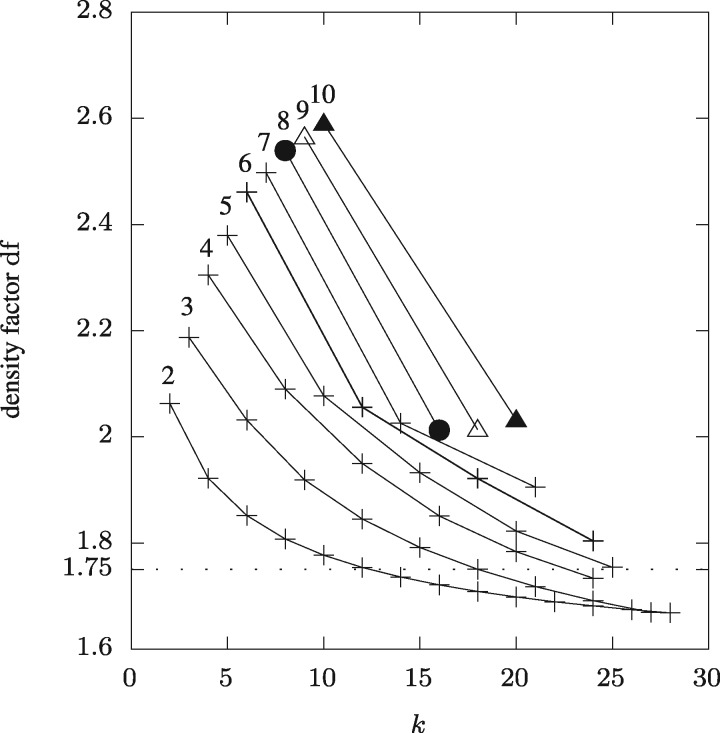
Fig. 4.
Each curve represents, for a fixed value of w, the density factor as a function of k obtained by minimizers schemes compatible with the universal sets constructed in Section 3.1. The value of w is written above the top left most point of each curve. The horizontal dotted line shows the previously believed lower bound for w = 2

