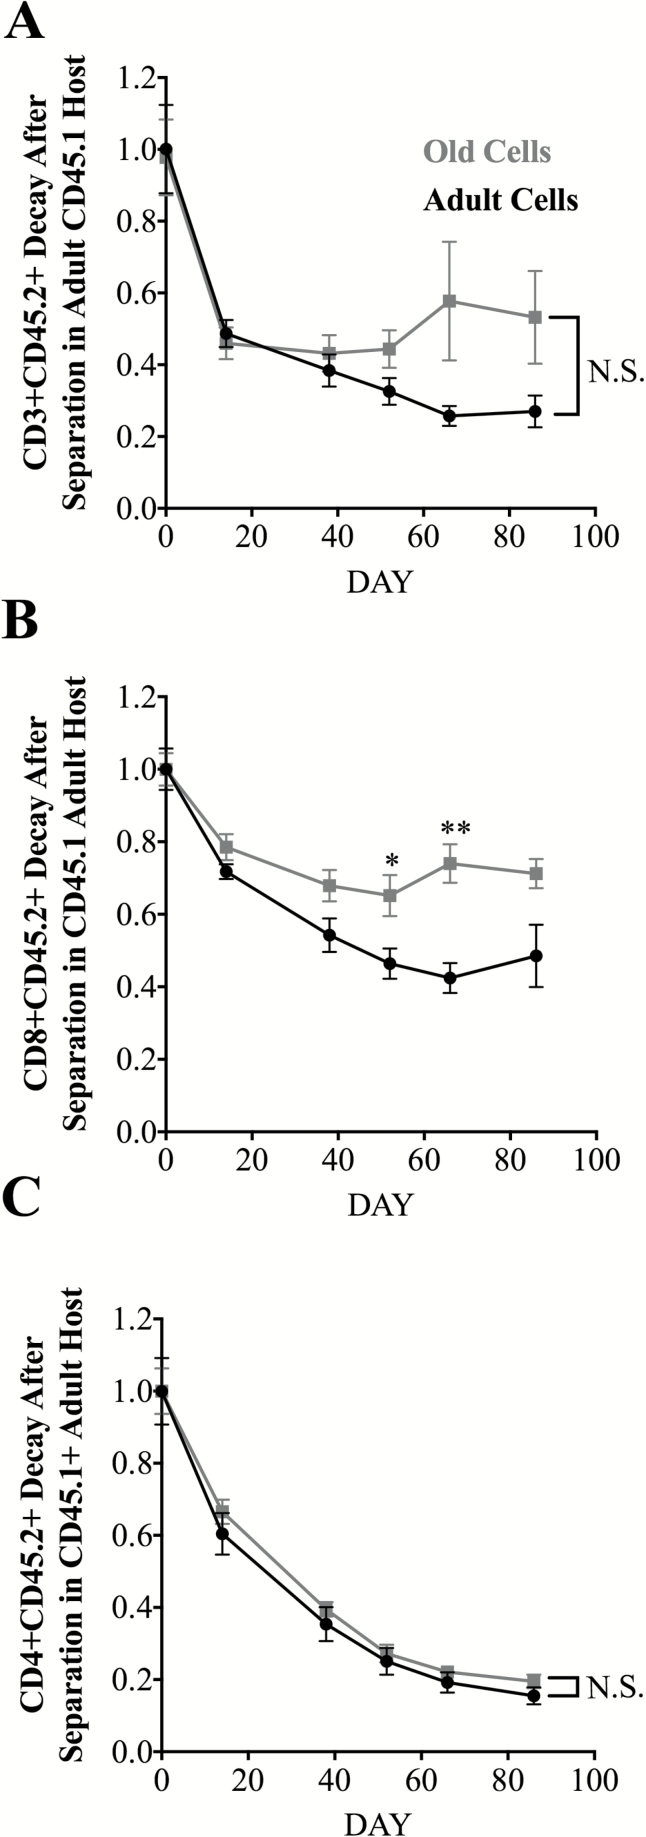
Figure 4.
Decay kinetics of CD45.2 adult or CD45.2 old T cells or their main subsets in adult CD45.1 parabionts after separation. Data represent the frequency of adult (CD45.2) or old (CD45.2) cells among the indicated T cell subset in blood, measured longitudinally after separation in CD45.1 adult parabionts. Starting % of CD45.1 or CD45.2 within population was normalized to one so decay of population could be directly compared. (A) CD3 T cell decay kinetics in the blood. (B) CD8 kinetics in the blood. (C) CD4 kinetics in the blood. Each group represents three to six mice pooled from two independent experiments. Statistical values depict difference in individual t test of time points *p < 0.05, **p < 0.01, ***p < 0.001, ****p <0.0001, and is ns not significant.

