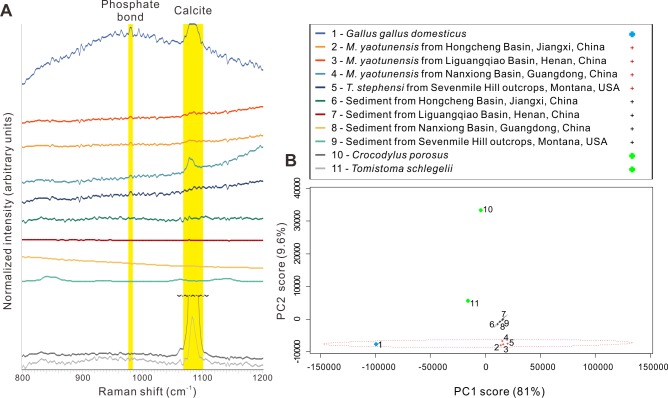
Figure 2. Raman spectra and chemometric analysis.
(A) Raman spectra derived from chicken, crocodilian, fossil dinosaur eggshells, and surrounding sediments. The peaks around 972–986 cm−1 and 1,063–1,097 cm−1 are marked by yellow bars, indicating the calcite and phosphate bonds. (B) The principle component chemometric analysis on the spectral area of 800–1,200 cm−1 shown in (A) demonstrates significant disparities between dinosaur/chicken eggshells, crocodilian eggshells, and sediments. Credit of the drawings: Tzu-Ruei Yang (Universität Bonn).

