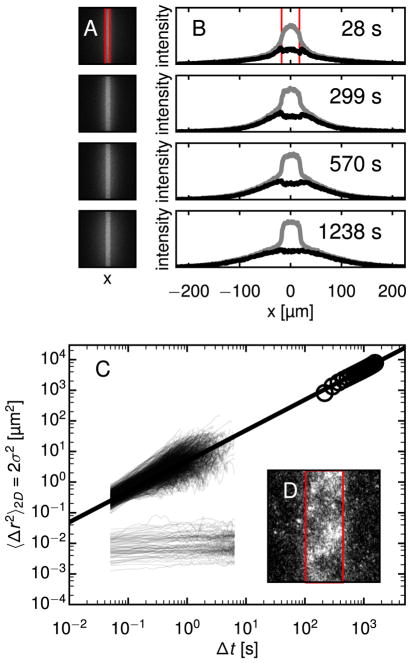
Fig. 3.
PANDA and MPT show bimodal particle mobility in fibrin gels. (A) Images at four times from a PANDA experiment in fibrin using a 20× objective are shown. The activated region, outlined in red, is 35 μm wide. Approximately half the particles diffuse from the activated region while the rest remain localized, apparently confined in the gel. (B) The intensity profile due to the mobile population (black curve) at these time points is separated from the total intensity (gray curves) as described in the text. (C) The MSDs of 1149 individual particle trajectories from MPT are plotted along with σ2(Δt) of the mobile population from PANDA. The MSDs from MPT also fall into mobile and immobile populations. A best-fit line to the PANDA data, giving a diffusivity D = 2.45 ± 0.2 μm2/s, passes through the mobile fraction of MSDs from MPT. (D) A view of an activated region of fibrin 1965 s after activation, imaged with a 40× objective, reveals a mottled pattern discussed in the text. Here, the width of the activation region, outlined in red, is 18 μm. (For interpretation of the references to color in this figure legend, the reader is referred to the web version of this article.)

