Fig. 4.
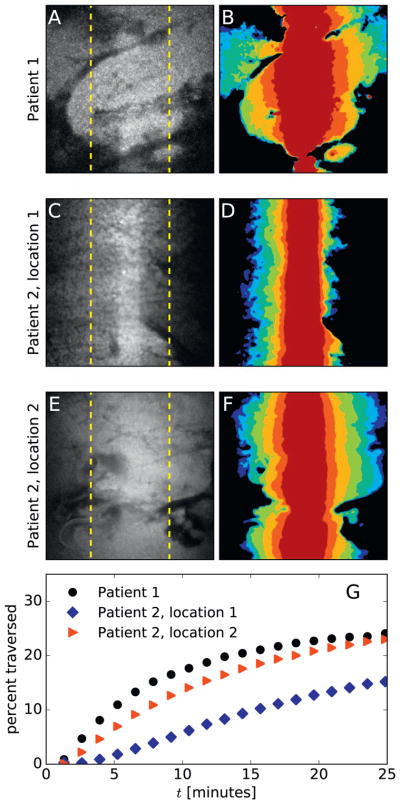
Particle transport in cystic fibrosis sputum (CFS). Three representative PANDA experiments on sputum from CF patients, performed with a 63× objective, show nano-particles diffusing tens of micrometers in tens of minutes. One video is from patient 1 and two videos are from patient 2, demonstrating heterogeneous behavior both between patients and within a single patient’s sputum. (A, C, E) The final image from each video shows the fluorescence distribution approximately 25 min after photoactivation. Dashed yellow lines denote a distance of 25 μm from the activation region, which is 17 μm wide. (B, D, F) The spread of the particles is portrayed as a contour plot, with the colors from dark red to blue marking the advancing front of activated particles approximately 0.5, 2, 5, 10, 15, 20, and 25 min after photoactivation. To generate the contour plots, the images were smoothed using a Gaussian with σ = 3 pixels, and then thresholded using a threshold of 0.25 times the maximum pixel value. (G) The percentage of particles that have diffused at least 25 μm from the initial activation region – calculated as the percentage of total fluorescence intensity outside the dashed yellow lines in (A), (C), and (E) – is plotted as a function of time for each video. (For interpretation of the references to color in this figure legend, the reader is referred to the web version of this article.)

