Fig. 5.
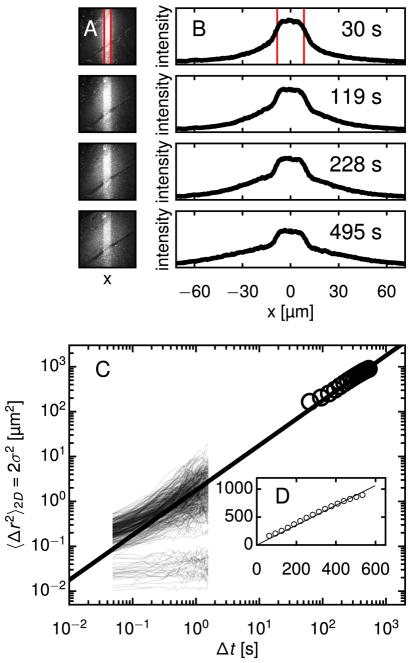
PANDA and MPT diffusion measurements in CFS over multiple time and length scales relevant to drug delivery. (A) Four time points from a PANDA experiment in CFS, in which the evolution was sufficiently homogenous to permit analysis as in Fig. 2, are shown. The PANDA experiment was conducted using a 63× objective. The red lines denote the boundary of the activation region, which is 17 μm wide. (B) Profiles for the time points in (A) are calculated. The scale of the intensity is the same for all plots. (C) σ2(Δt) from PANDA is plotted along with MSDs of 273 individual particle trajectories from MPT in the same CFS sample. A best-fit line to the PANDA data, giving a diffusivity D = 0.44 ± 0.1 μm2/s, passes through the mobile population of MSDs from MPT, whose ensemble-averaged diffusivity is D = 0.49 ± 0.18 μm2/s. (D) A plot of the PANDA data and best-fit line on linear axes. (For interpretation of the references to color in this figure legend, the reader is referred to the web version of this article.)

