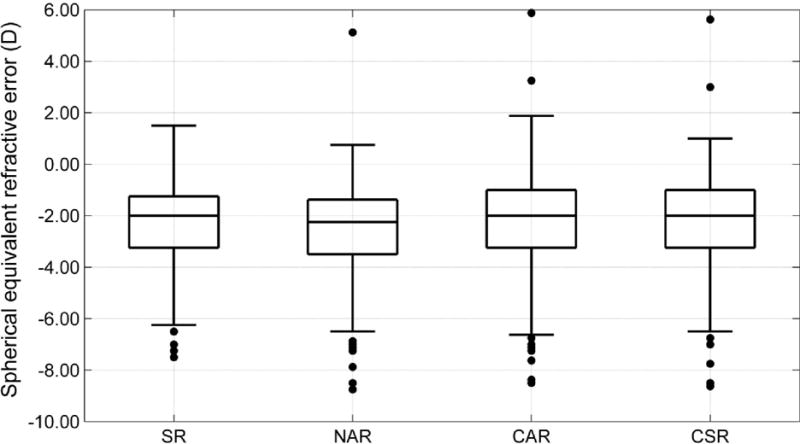
Figure 2.

Box plot representations of the distribution of spherical equivalent refractive error based on self-refraction (SR), non-cycloplegic auto-refraction (NAR), cycloplegic auto-refraction (CAR), and cycloplegic subjective refraction (CSR). Each box extends from the 25th to the 75th percentile, the interquartile range, with the inside bar representing the median. Whiskers extend to the lower and upper extremes, defined as the 25th percentile minus 1.5 times the interquartile range and the 75th percentile plus 1.5 times the interquartile range.
