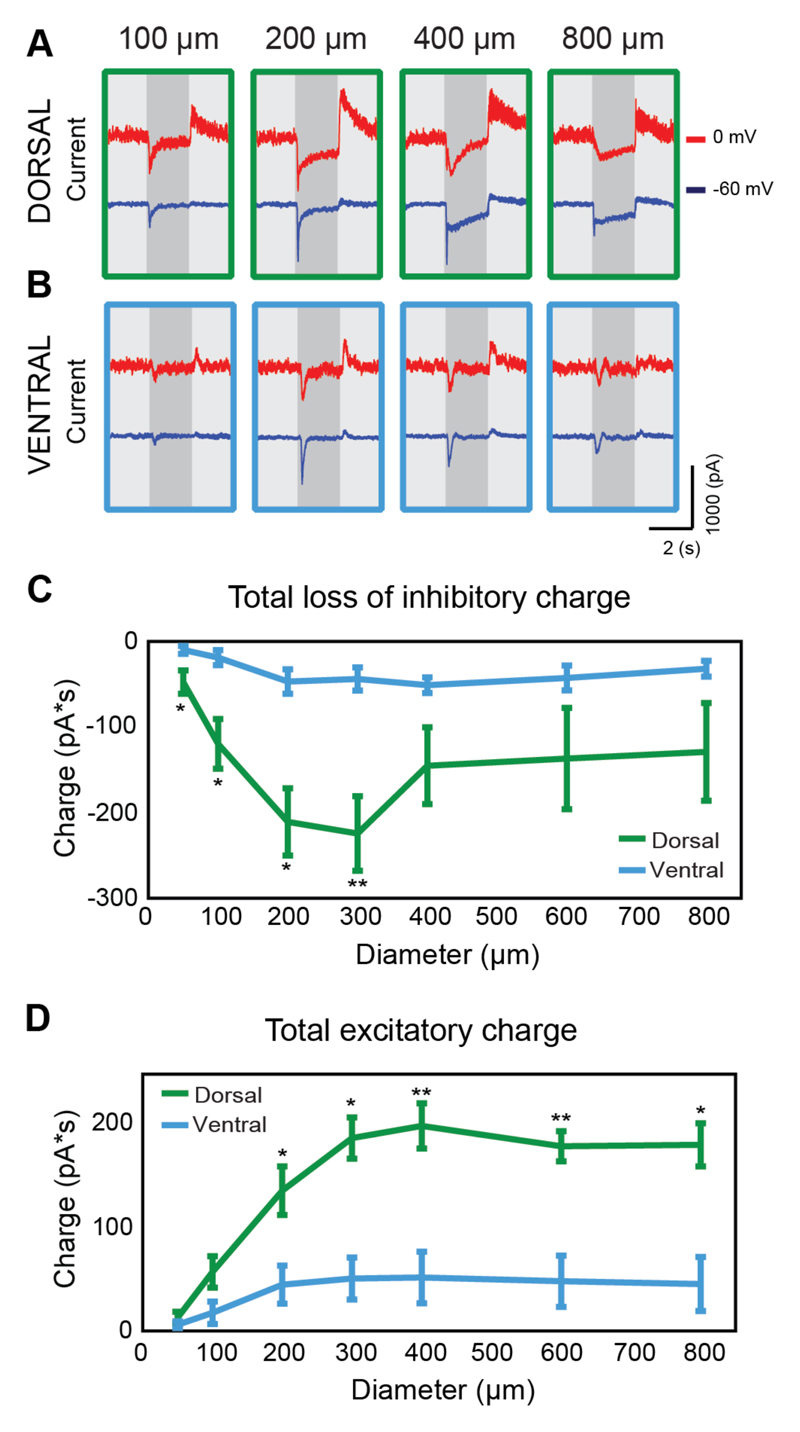
Figure 5. Excitatory and inhibitory synaptic inputs differ between dorsal- and ventral-tOff-αRGCs.
(A,B) Current traces of an example dorsal-tOff-αRGC (A) and an example ventral-tOff-αRGC (B) when held at 0 (red) and -60 (blue) mV. (C,D) Total loss of inhibitory charge (C) and total gain of excitatory charge (D) during the two second spot presentation as a function of spot size for dorsal- and ventral-tOff-αRGCs. Error bars represent the mean ± s.e.m., n=5 for each group, * P<0.05, ** P<0.01, according to Wilcoxon Rank Sum test.

