Figure 4.
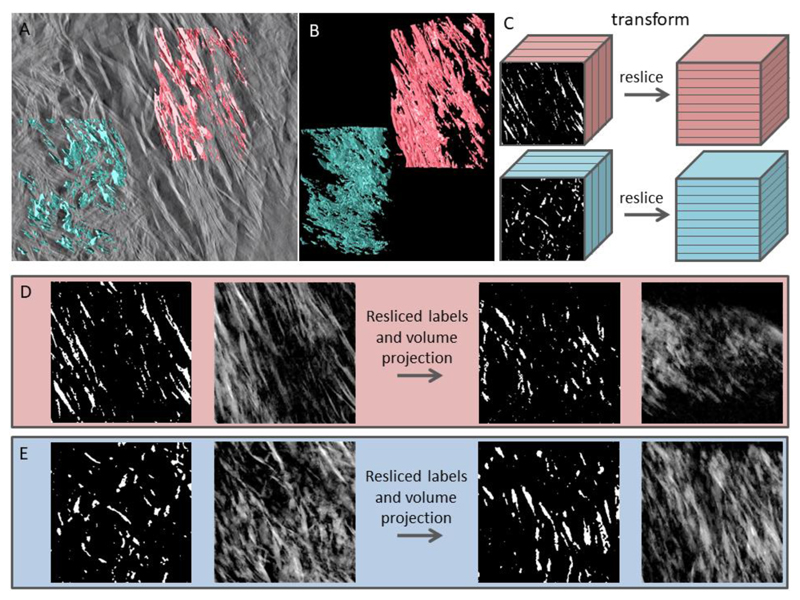
Labeling algorithm and comparison of the lacey and filamentous patterns in bone in reciprocally oriented projections. (A) Tomogram slice with superimposed labels of the lacey (blue) and filamentous (pink) patterns. (B) Labeled volumes show extensively aggregated and coalesced elongated entities of variable size and irregular shape. (C) Volumes cropped to an identical size in all 3 dimensions are transformed in such a way that former XY-planes now are XZ-planes, i.e. the in-plane labels are viewed in the out-of-plane orientation, and vice versa. (D) Digital manipulation of the filamentous label field (from left to right): original labels in a cubic stack are averaged in terms of pixel value to form a pseudo-2D image, which is similar to the corresponding area in (A). The resliced label field stack is averaged in terms of pixel value to form a pseudo-2D image in an orthogonal direction. (E) Digital manipulation of the lacey label field follows the same sequence of steps. Note the similarity of the resliced projected filamentous label field to the original lacey motif, and vice versa.

